shivani singh
- August 30, 2021
Step by Step to Setup Monitorix Monitoring Tool on Ubuntu 20.04 LTS
Monitorix is a free & open-source monitoring tool. It is used for collecting the system data and using a interface to display the information. It shows the data in graphs format. Using Monitorix, we can collect system performance,network performance and file system performance information.
There are few steps to setup Monitorix on ubuntu:
Step 1: Update the System.
apt-get update
Step 2: Add & Install the Repo.
echo "deb https://apt.izzysoft.de/ubuntu generic universe" > /etc/apt/sources.list.d/monitorix.list

wget -qO- https://apt.izzysoft.de/izzysoft.asc | apt-key add -
Step 3: Update the packages.
apt-get update
Step 4: Install Monitorix.
apt-get install monitorix
- Start & Enable the Monitorix.
systemctl start monitorix

systemctl enable monitorix
- Check the status of Monitorix.
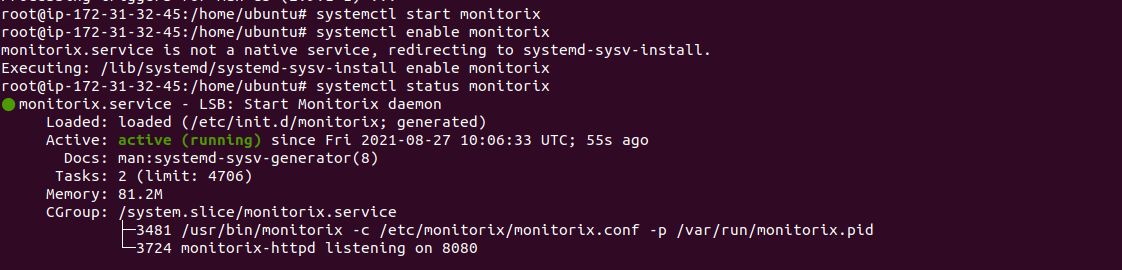
systemctl status monitorix
- Here is the command output.
- Check the Monitorix Version.
monitorix -v
- Here is the command output.

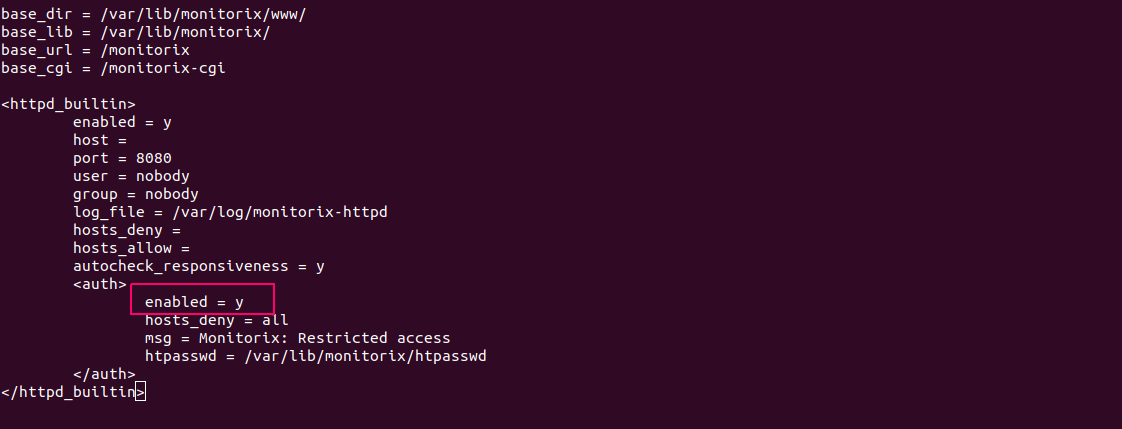
Step 5: Configure the Monitorix.
vim /etc/monitorix/monitorix.conf
- Edit the following line:
<auth>

enabled = y

hosts_deny = all

msg = Monitorix: Restricted access

htpasswd = /var/lib/monitorix/htpasswd

</auth>

</httpd_builtin>
- Here is the output.
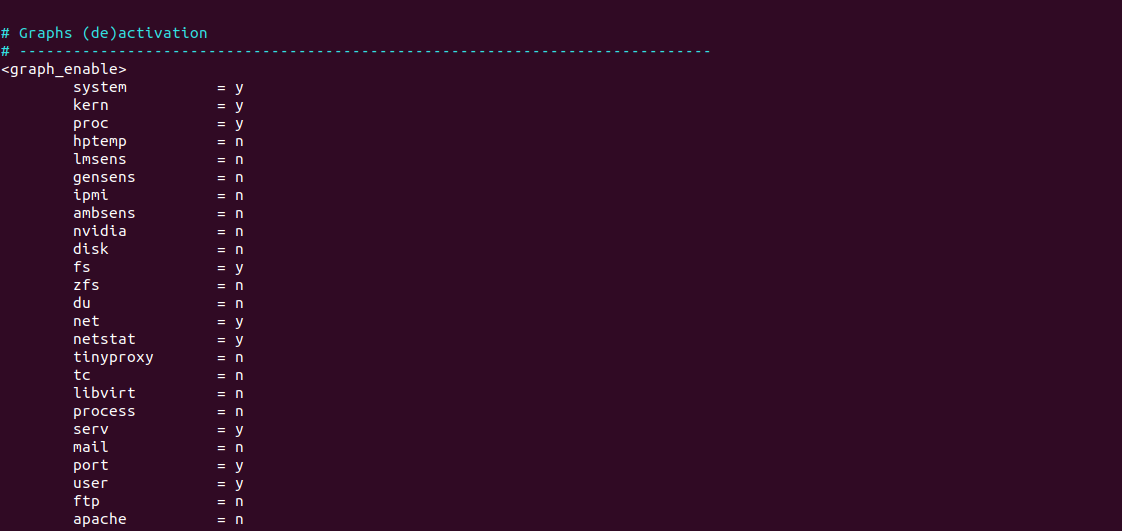
- We can also enable or disable the monitorix graphs.
- Here is the output.
Step 6: Install Apache Utilities.
apt-get install apache2-utils
- Add the user name & password.
htpasswd -d -c /var/lib/monitorix/htpasswd admin
- Here is the command output.

- Restart the Monitorix.
systemctl restart monitorix
Step 7: Enable the following port number on UFW firewall.
ufw allow 8080/tcp
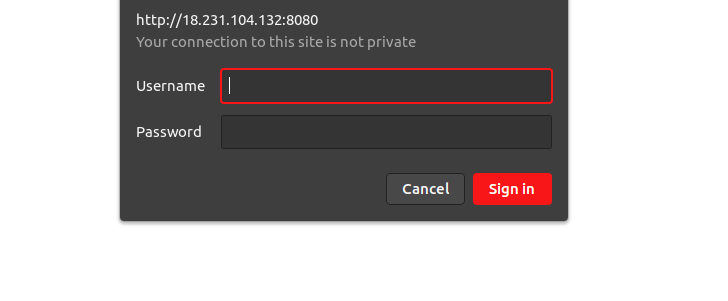
Step 8: Access the Monitorix Web-interface
http://server-IP:8080/monitorix
- Here is the output.
- Provide the User-name & Password.
- Click on sign in.
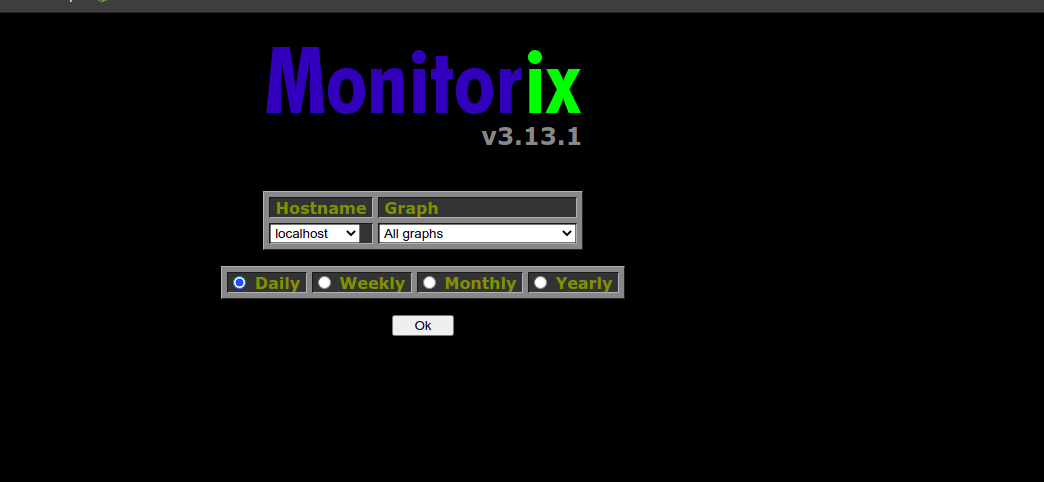
- Select the Hostname.
- We have multiple options to select monitorix Graph such as system load, memory allocation,kernal usage,filesystem usage,& eth0 network traffic etc.
- Select daily,weekly,monthly or yearly monitoring.
- Click on Ok.
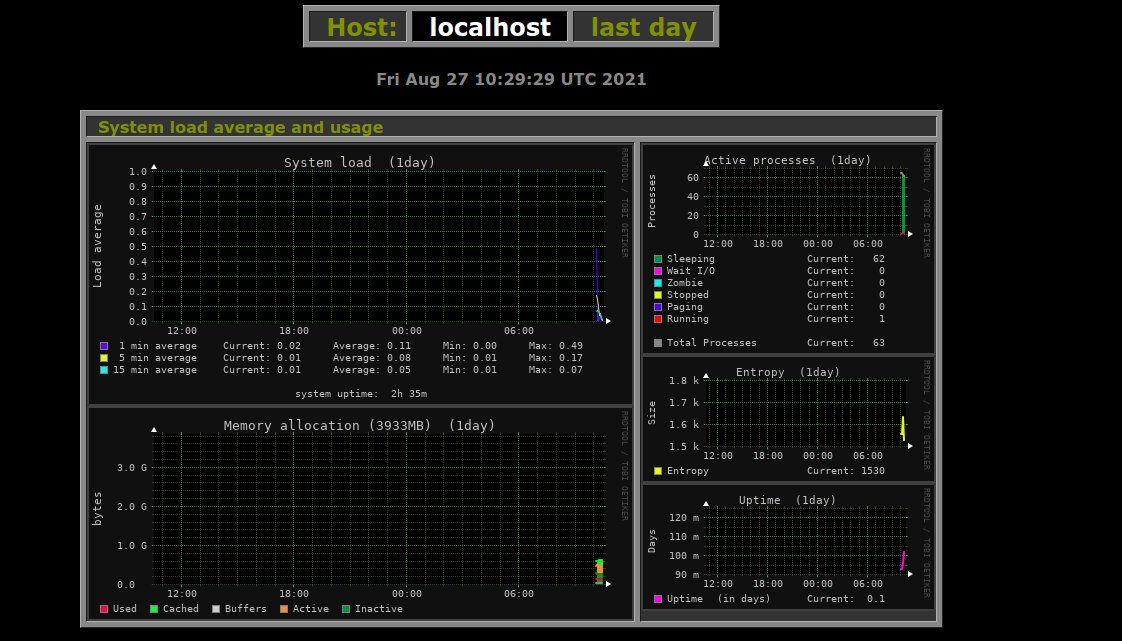
- Here,System load average & usage graph.
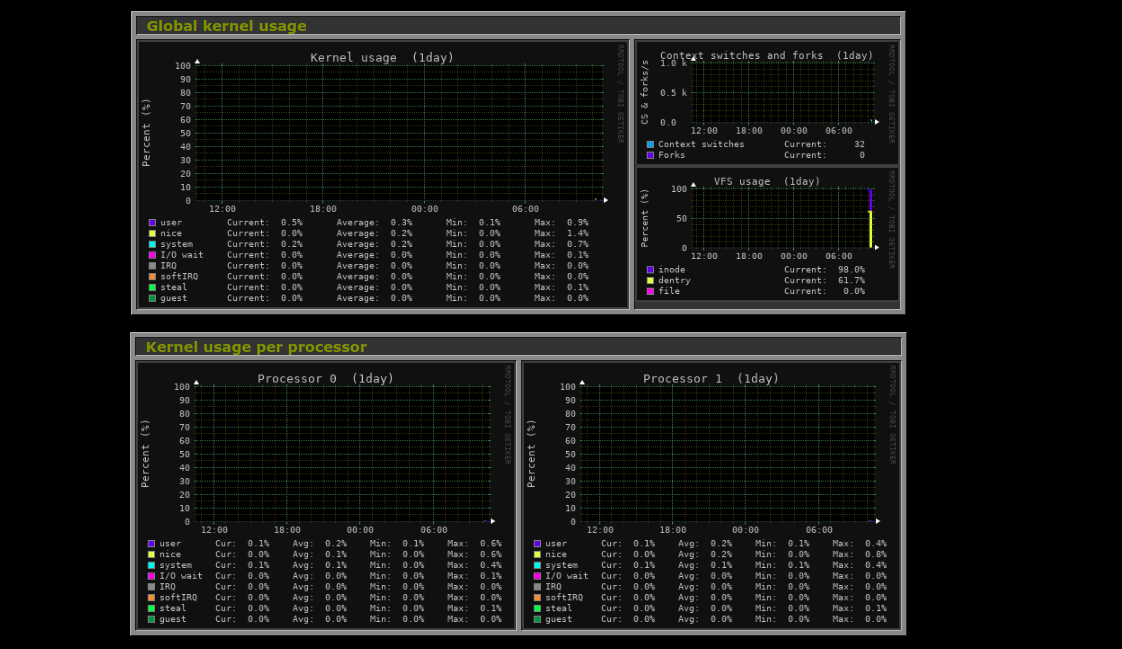
- Global Kernal usage & Kernal usage per processor graph.
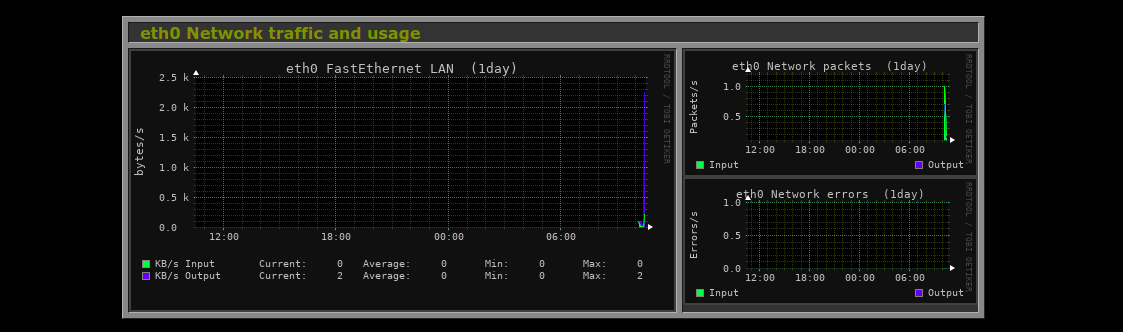
- eth0 Network traffic & usage graph.
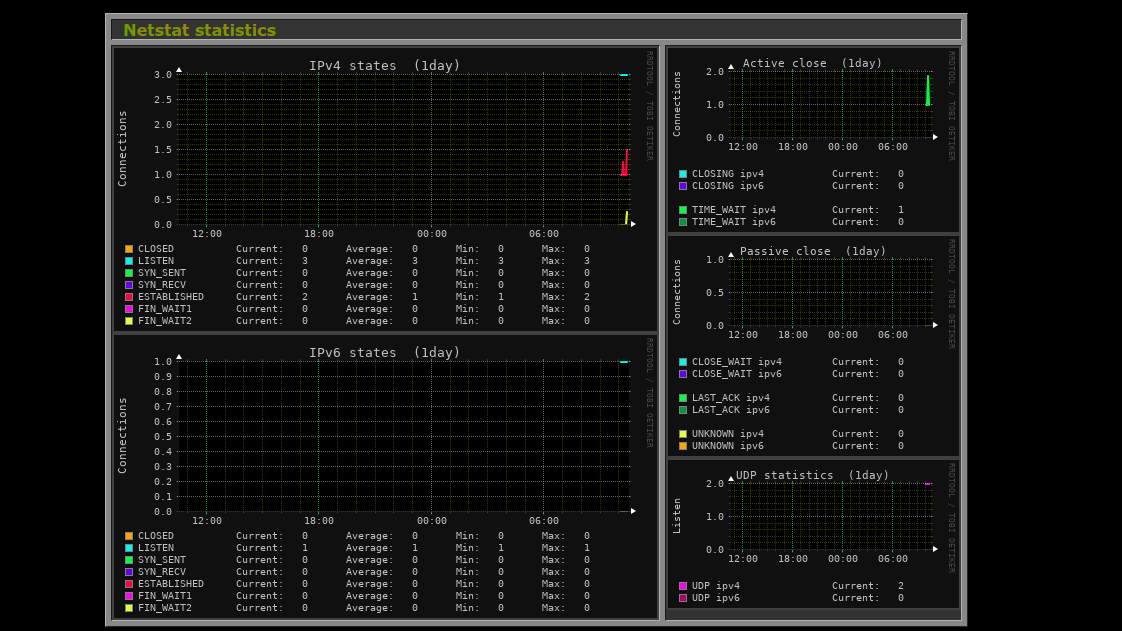
- Netstat statistics graph.
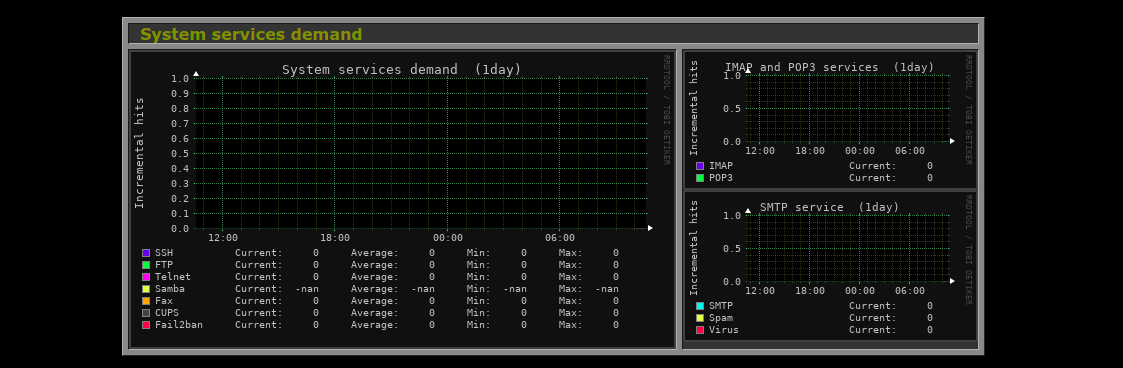
- System service demand graph.
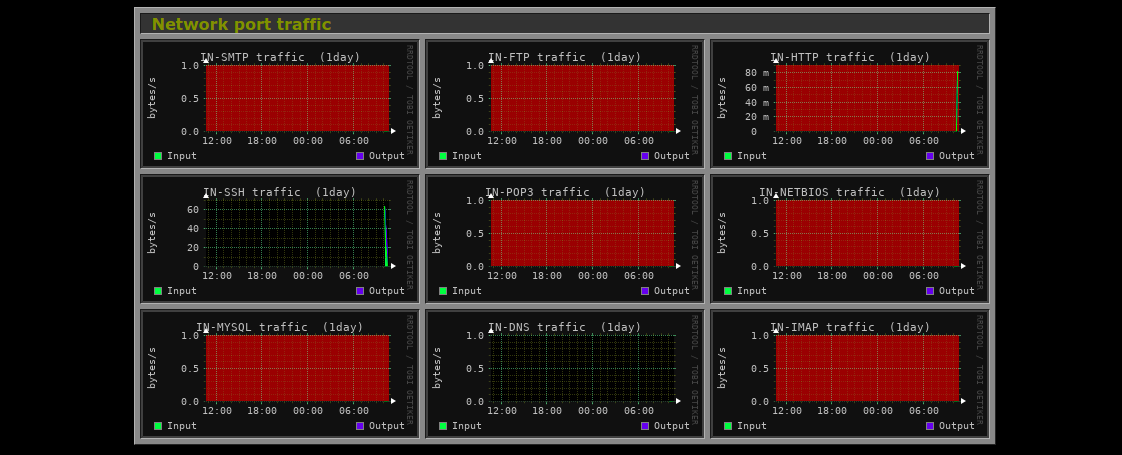
- Network port traffic graph.