shivani singh
- October 13, 2021
Steps to Install ‘atop’ to Monitor Logging Activity of Linux System Processes
Atop is a free & open source performance monitoring tool. It helps to monitor the detailed information about the process, memory, disk network information, and metrics.
There are few steps to install atop on ubuntu:
Step 1: Update the System.
apt-get update
Step 2: Install atop on system.
apt-get install atop
- Check the atop version.
atop -V
- Here is the command output.

Step 3: atop Syntax & examples:
- Run the following command to monitor interface.
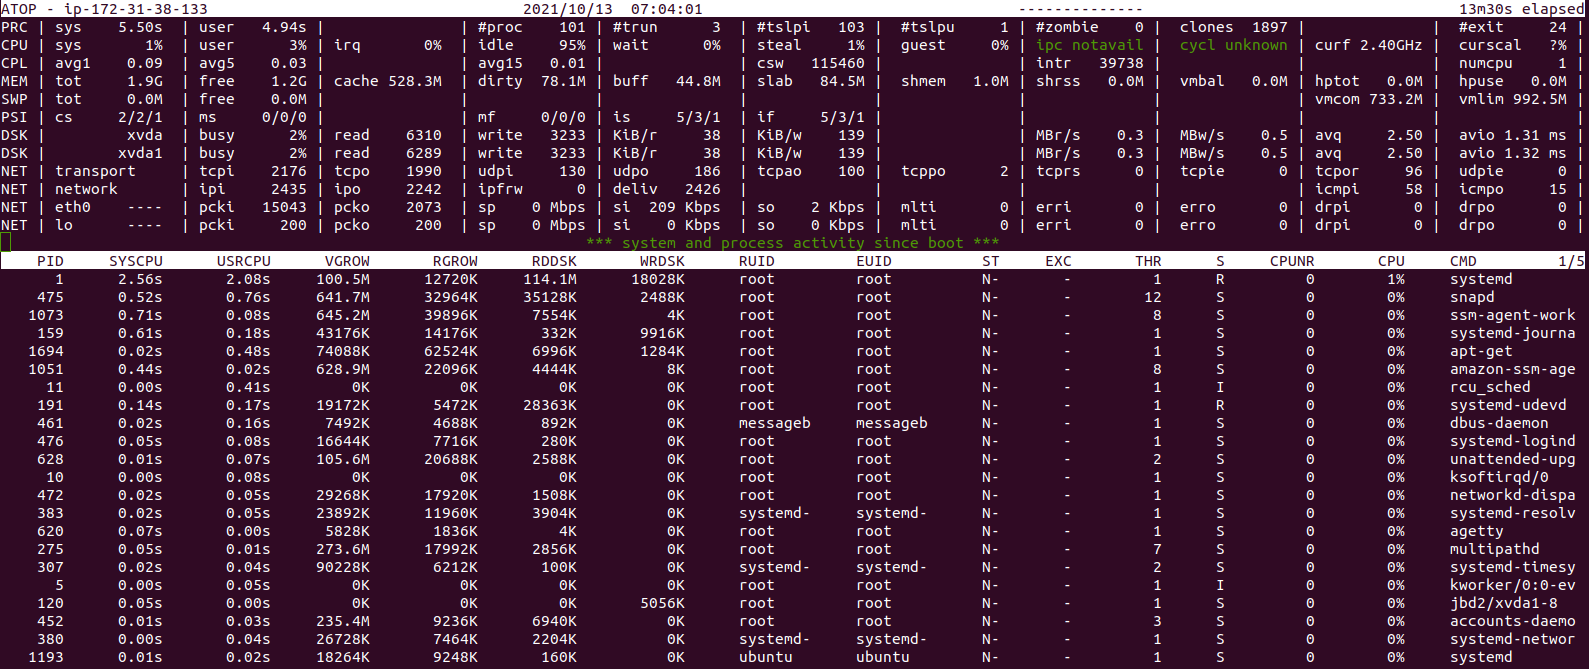
atop
- Here is the command output.
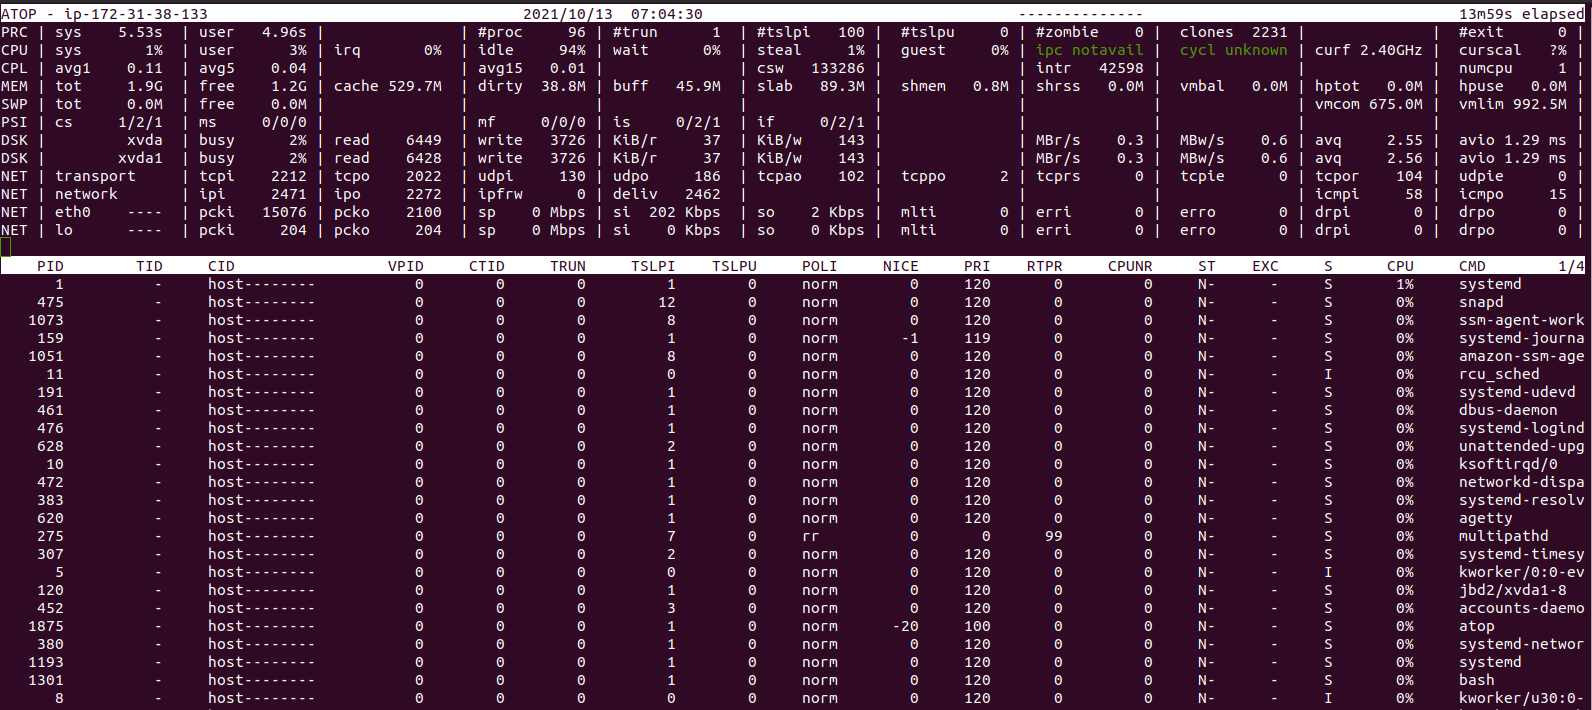
- To display scheduling information for the main thread of each process.
atop -s
- Here is the command output.
- To list memory related information about all running processes.
atop -m
- Here is the command output.
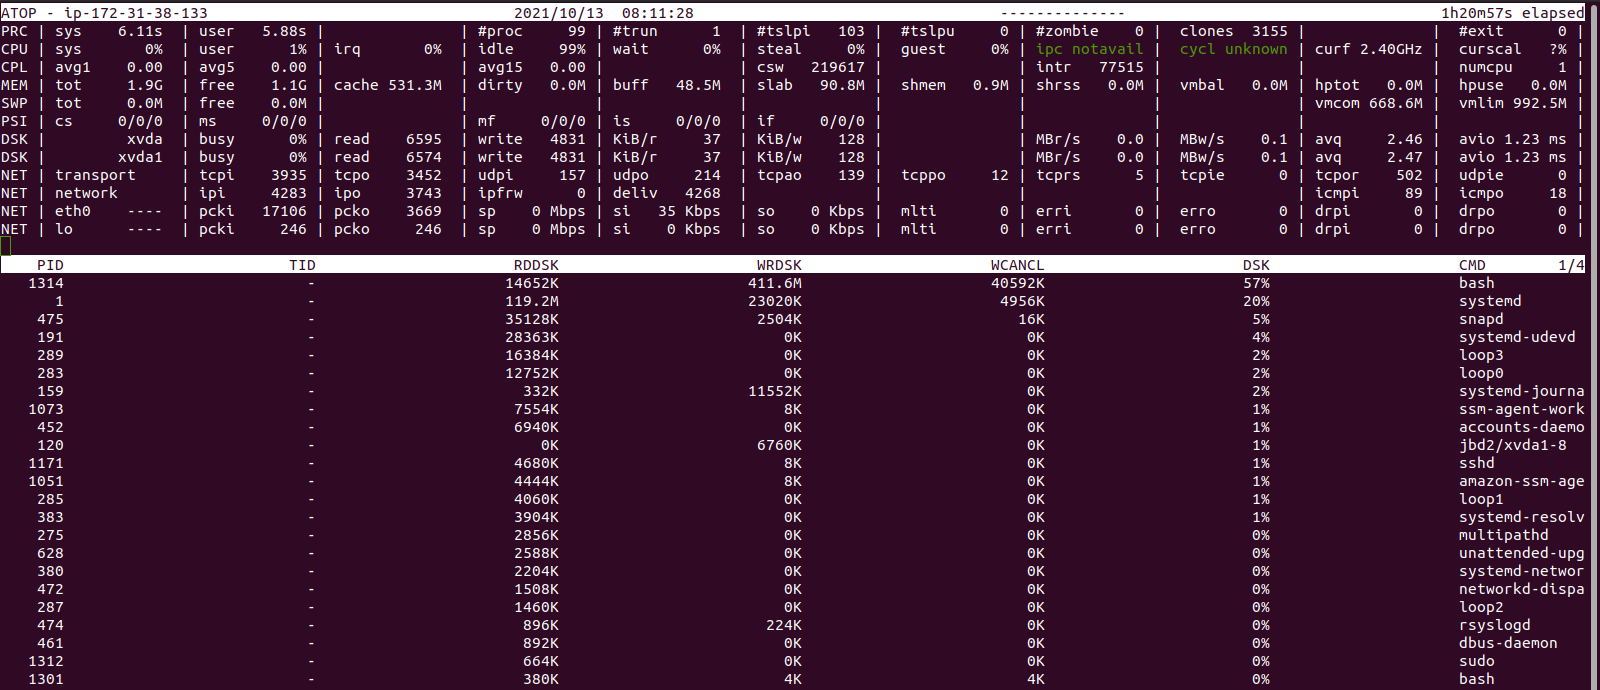
- To display the disks activity..
atop -d
- Here is the command output.
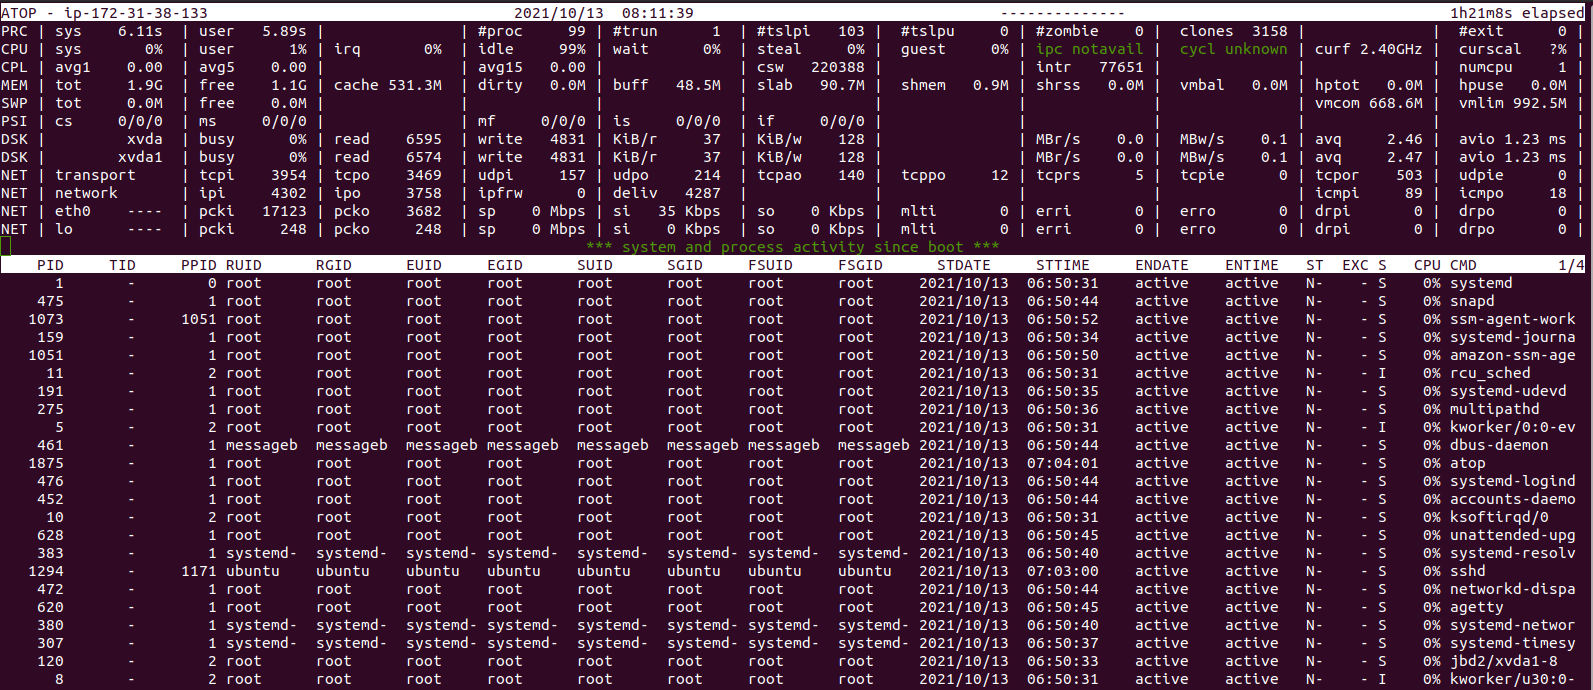
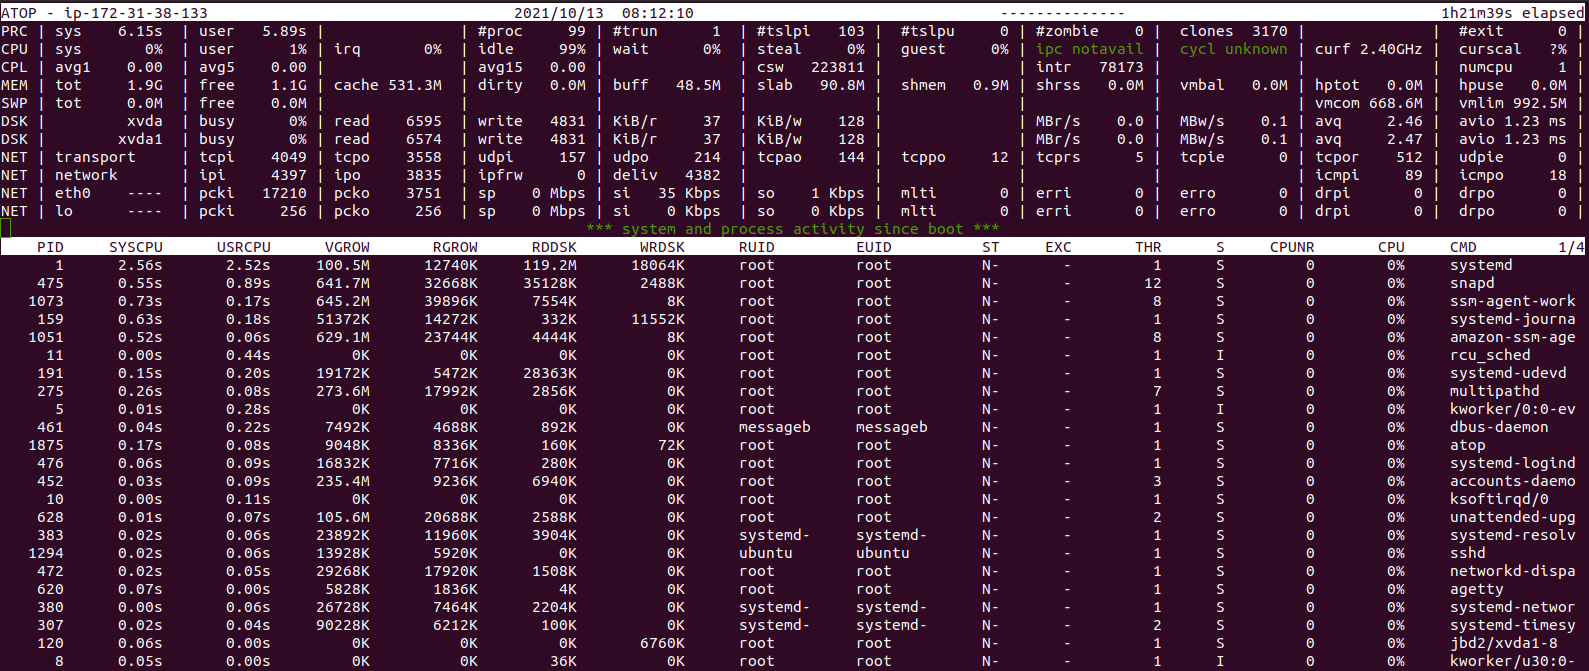
- To list the data about the running processes like uid, pid, gid,& cpu usage.
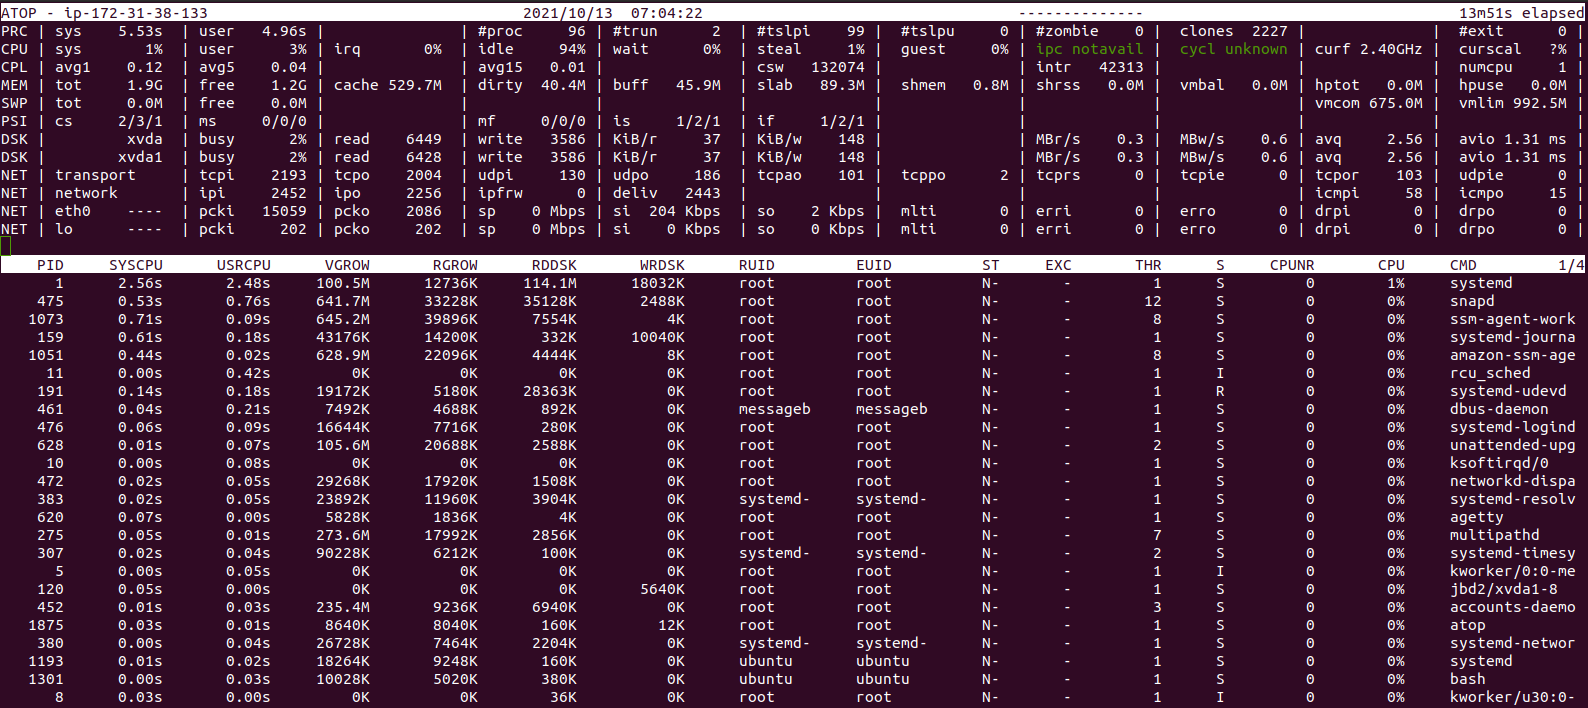
atop -v
- Here is the command output.
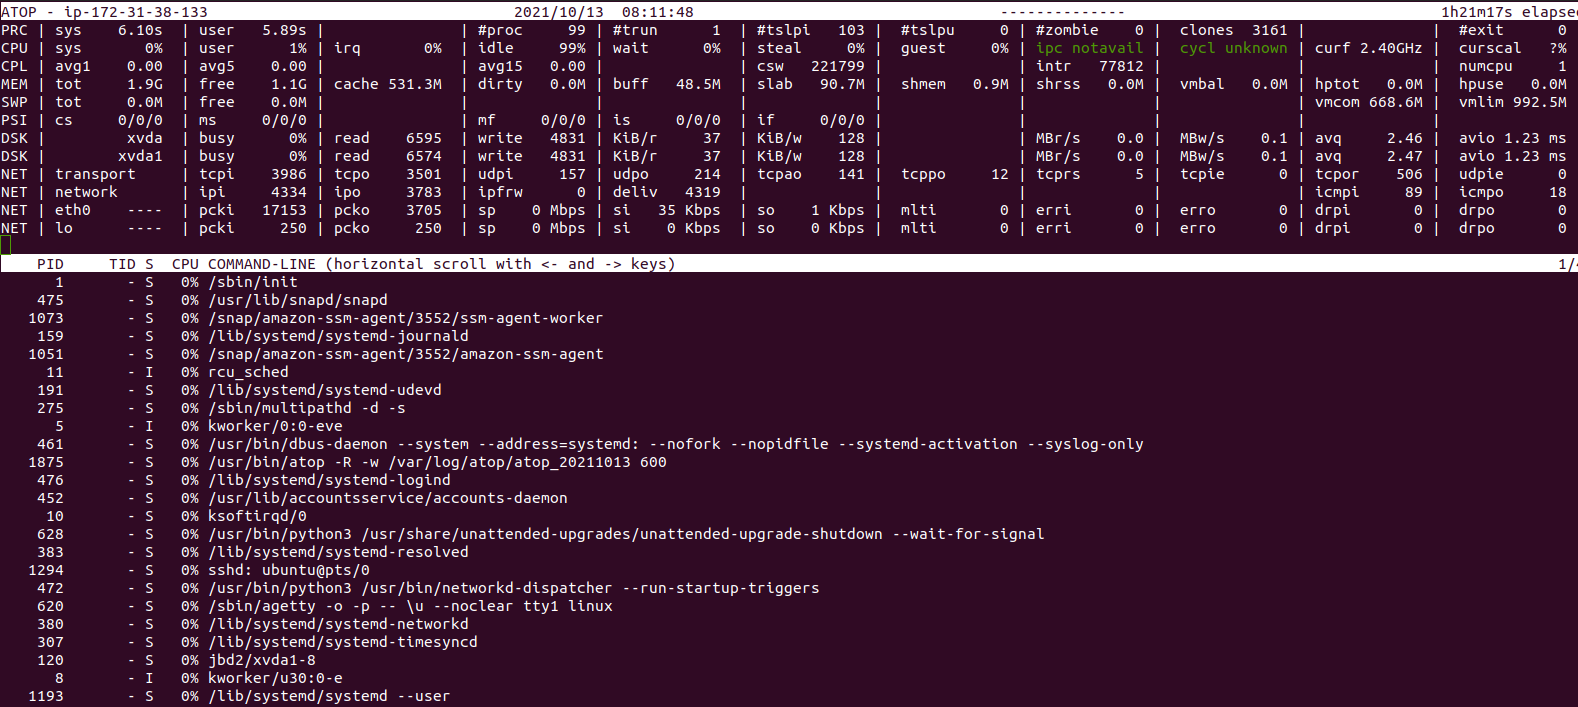
- T0 show command line per process.
atop -c
- Here is the command output.
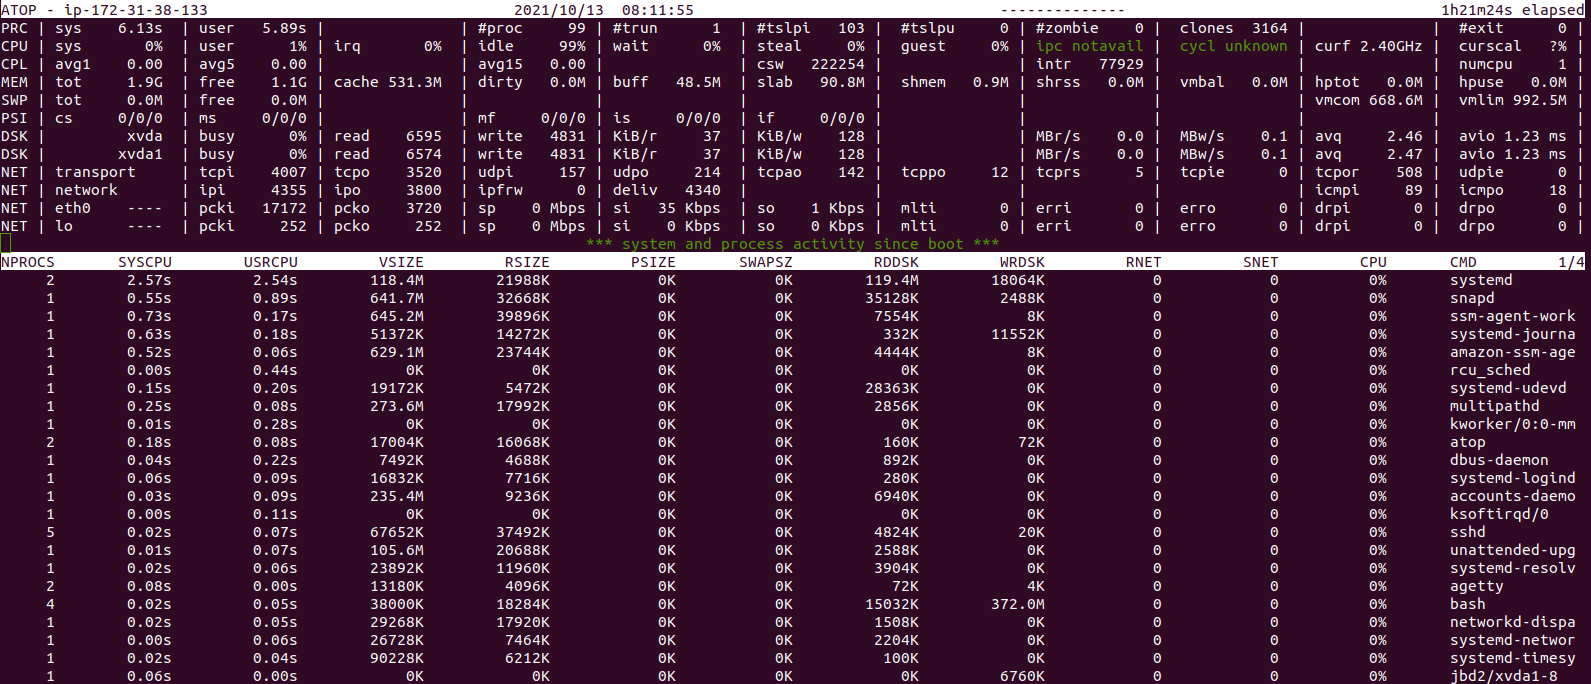
- To list cumulated process-info per program.
atop -p
- Here is the command output.
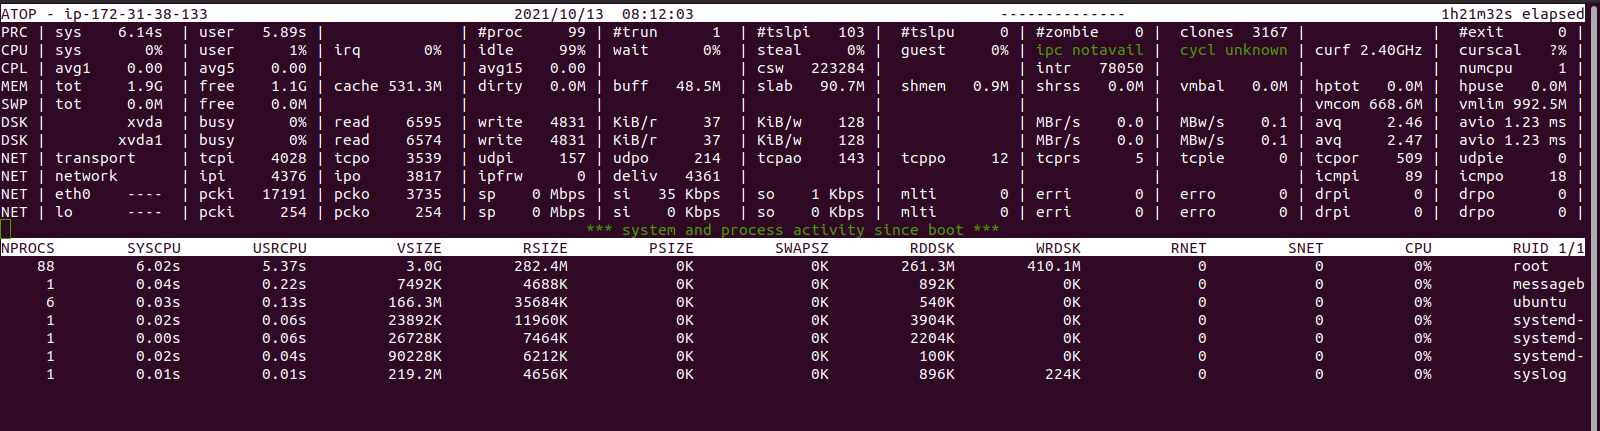
- To list cumulated process-info per user.
atop -u
- Here is the command output.
- To list processes in order of network activity.
atop -n
- Here is the command output.
- To see todays logs beginning 07:04 server time.
atop -r -b 07:04 -l 1
- Here is the command output.