 shivani singh
- January 16, 2022
Steps to Setup Alert on Virtual Machine Disk Using Agent in Microsoft Azure
Hello, Here we are discussing how to setup alert on virtual machine disk. This is a critical issue on azure because we need to install a Agent for configuration Vm disk on insights. When we enabled the insights it create a default log analytics workspace. Log analytics workspace provides a VM extension or Agent for Linux.Now Install the Agent on vm machine & configure the alert on virtual machine disk.
There are some points to setup virtual machine disk in insights & create a alert rule for virtual machine disk in Microsoft azure:
- Login to Azure Portal.
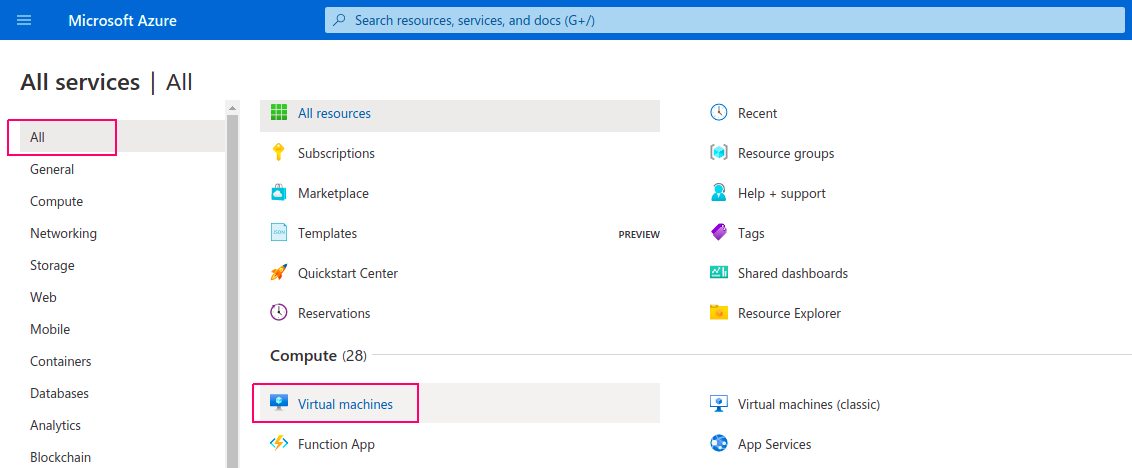
- Click on All Services.
- Select Virtual machine.
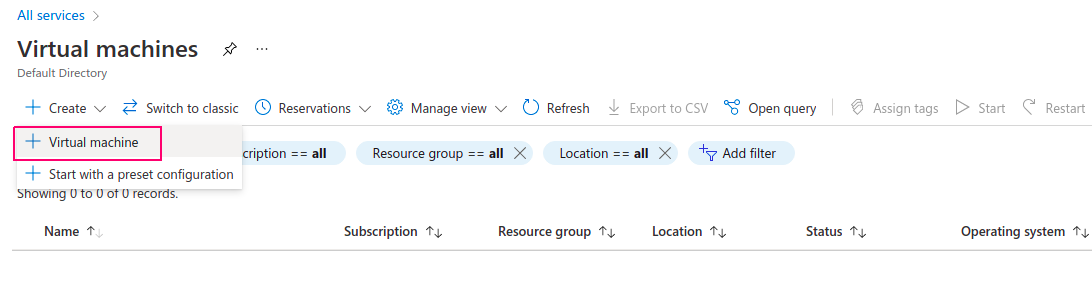
- Click on create.
- Then click on link https://www.hackerxone.com/2021/04/23/how-create-virtual-machine-microsoft-azure/ for how to create a virtual machine.
- Once Virtual machine is created.
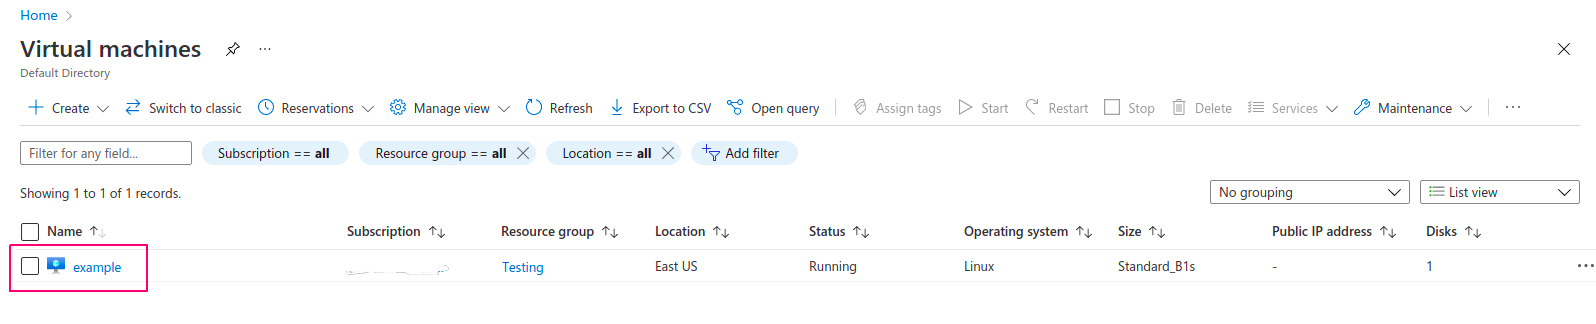
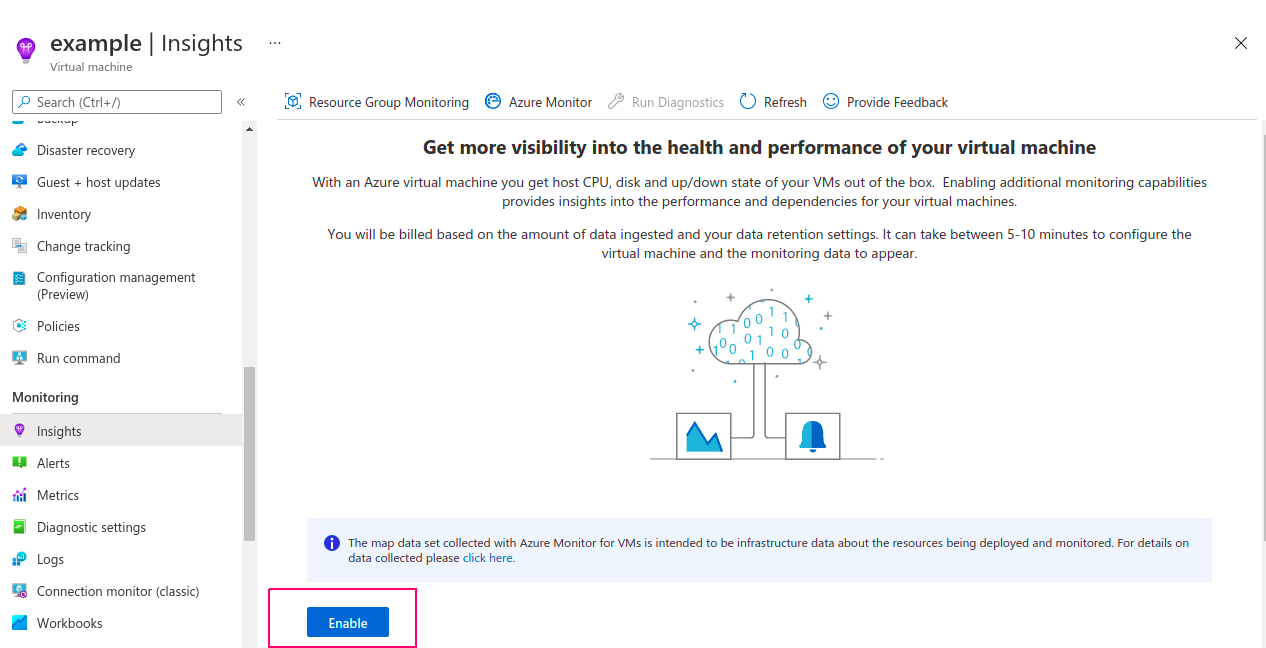
- Click on created virtual machine,click on Insights.
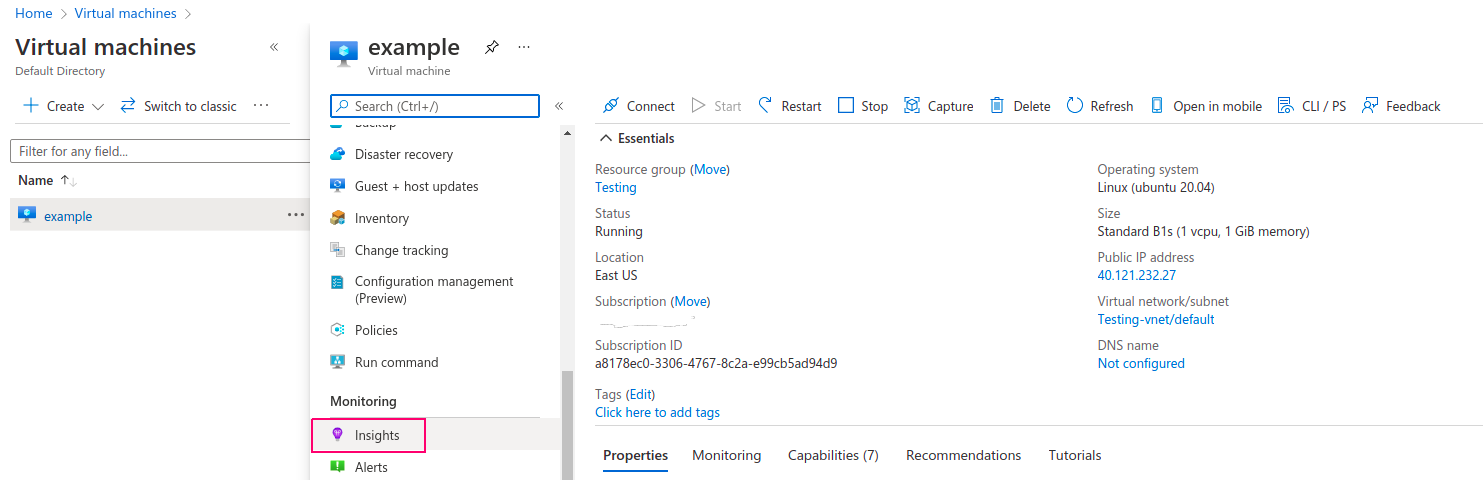
- To enable the insights monitoring so click on Enable.
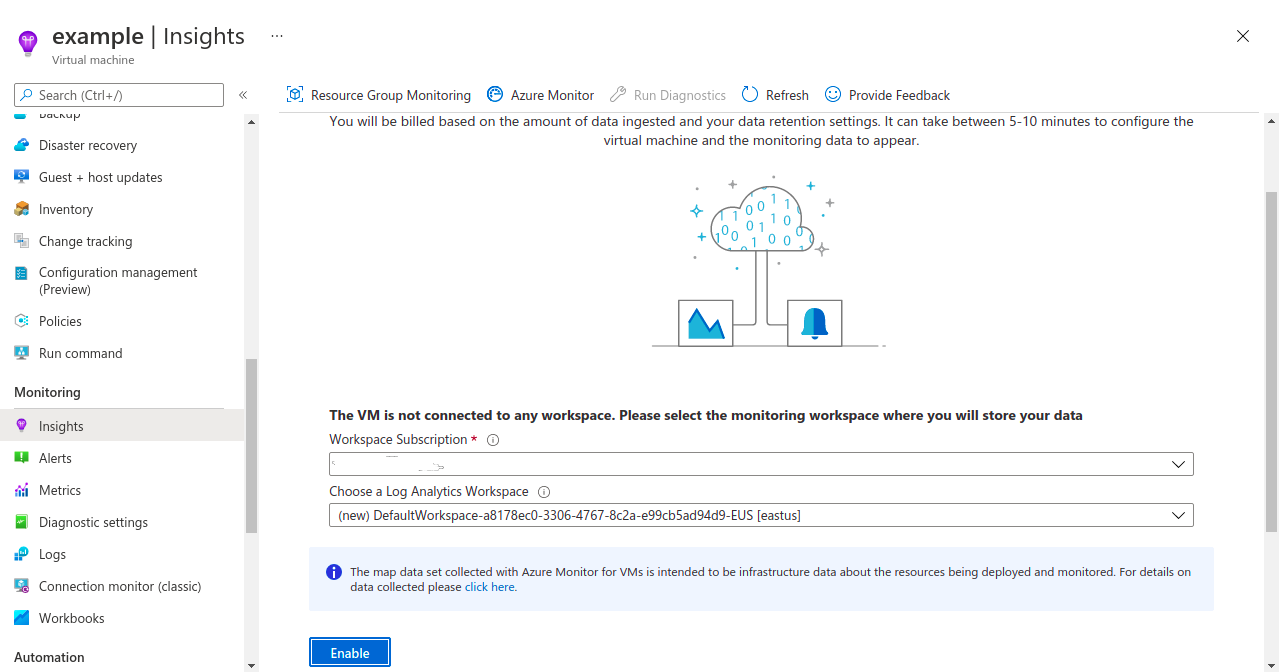
- Virtual machine is not connected to any workspace.Create or select existing log analytics workspace then click on Enable.
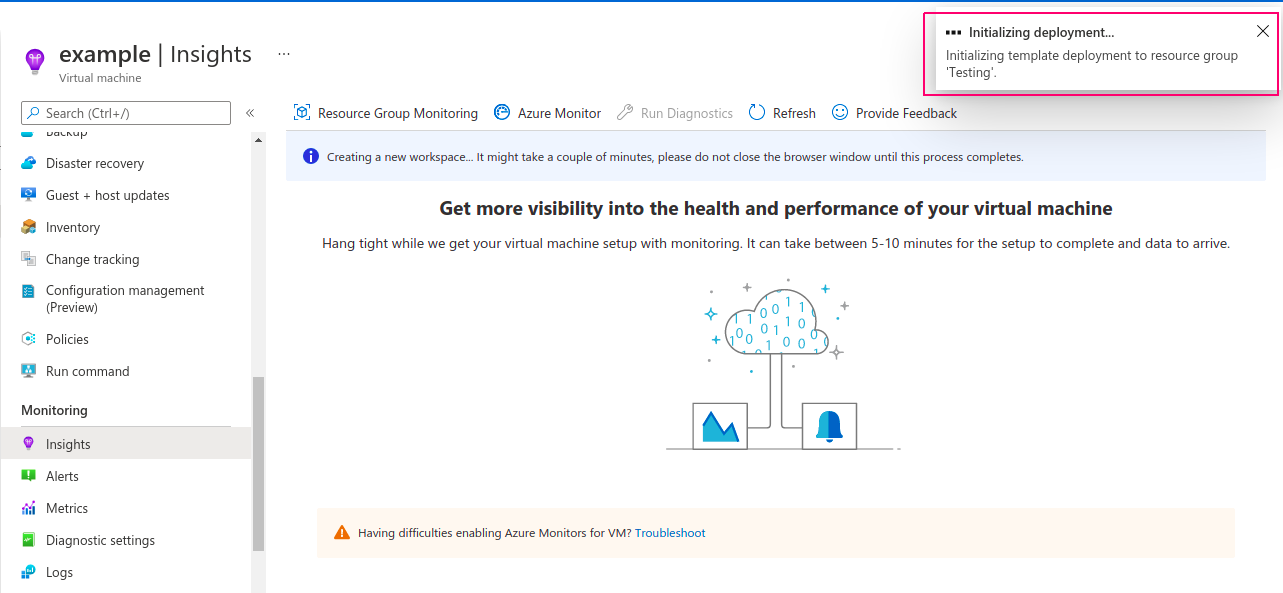
- Now Deployment is initializing.
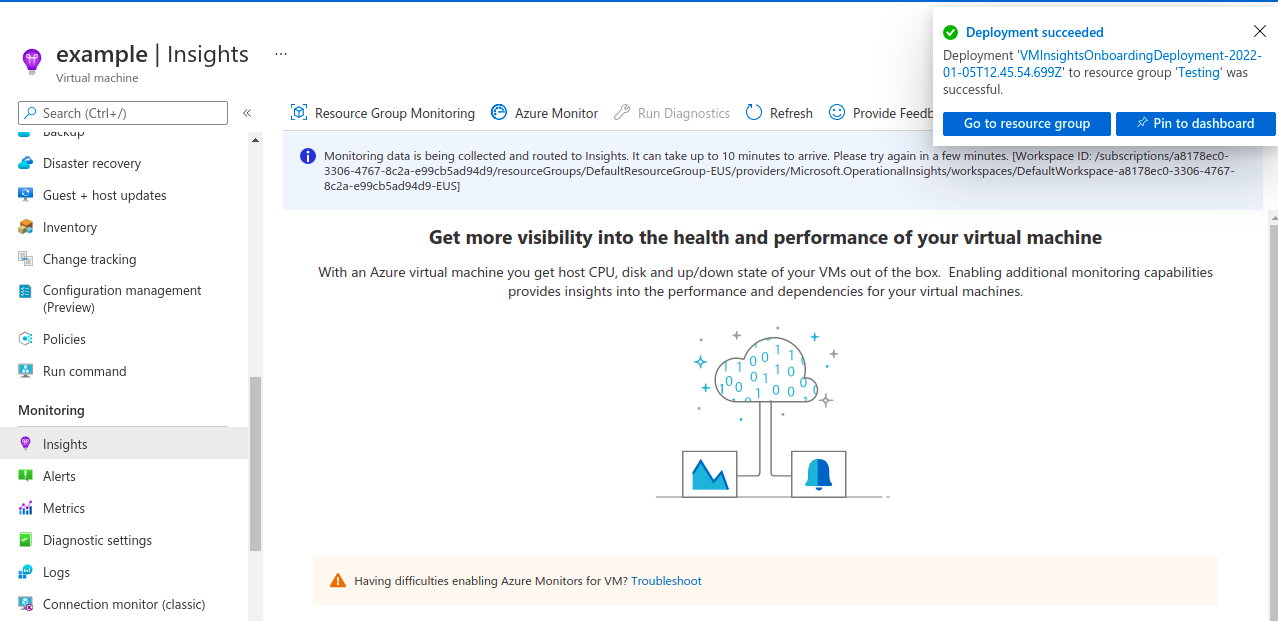
- Once Deployment is Done.It takes 5-10 min to collect the data & route to insights.
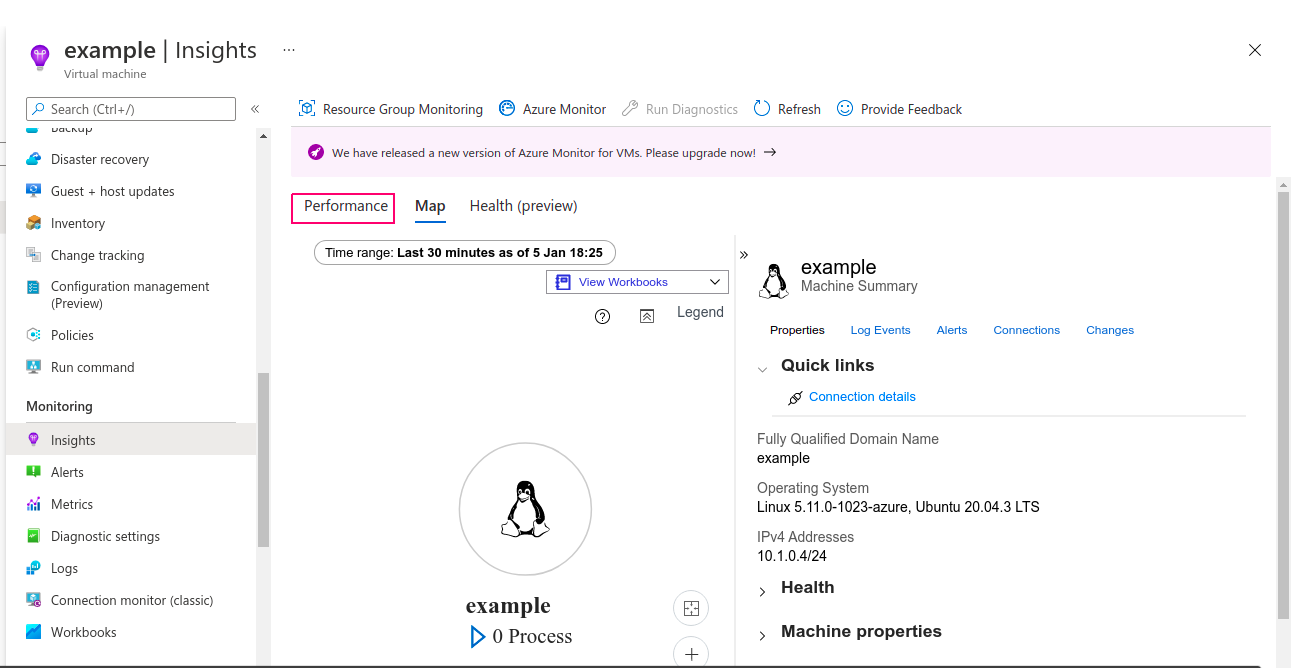
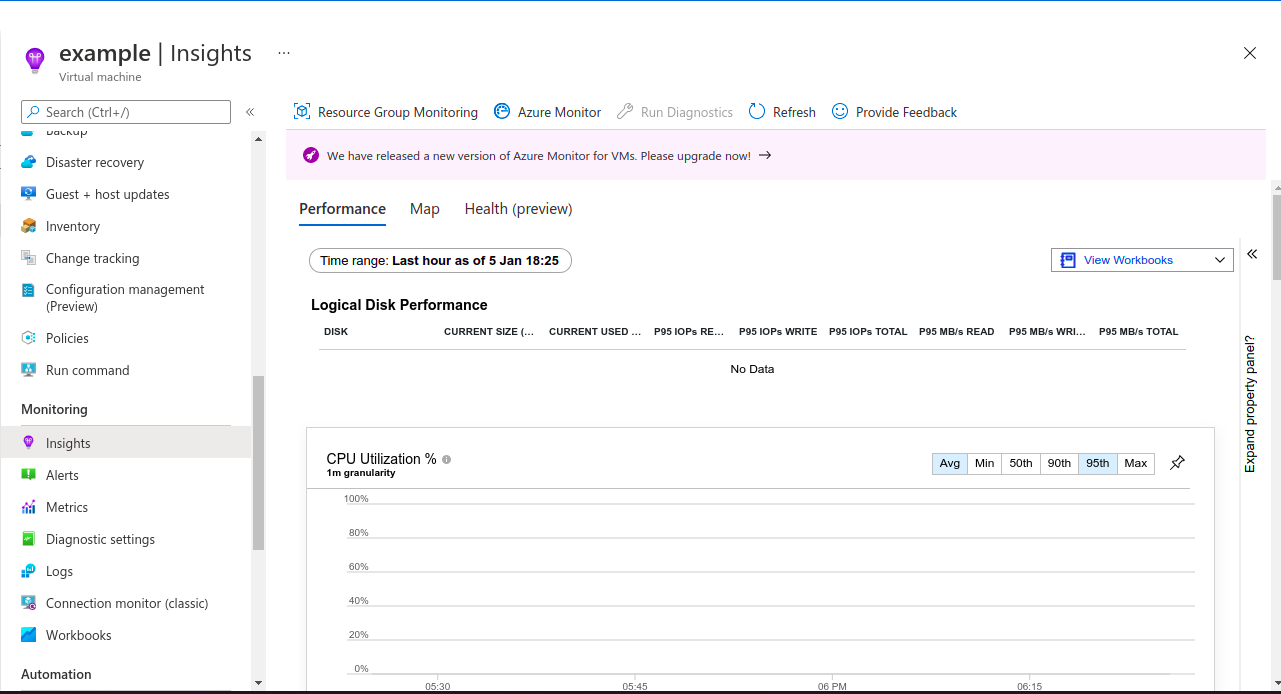
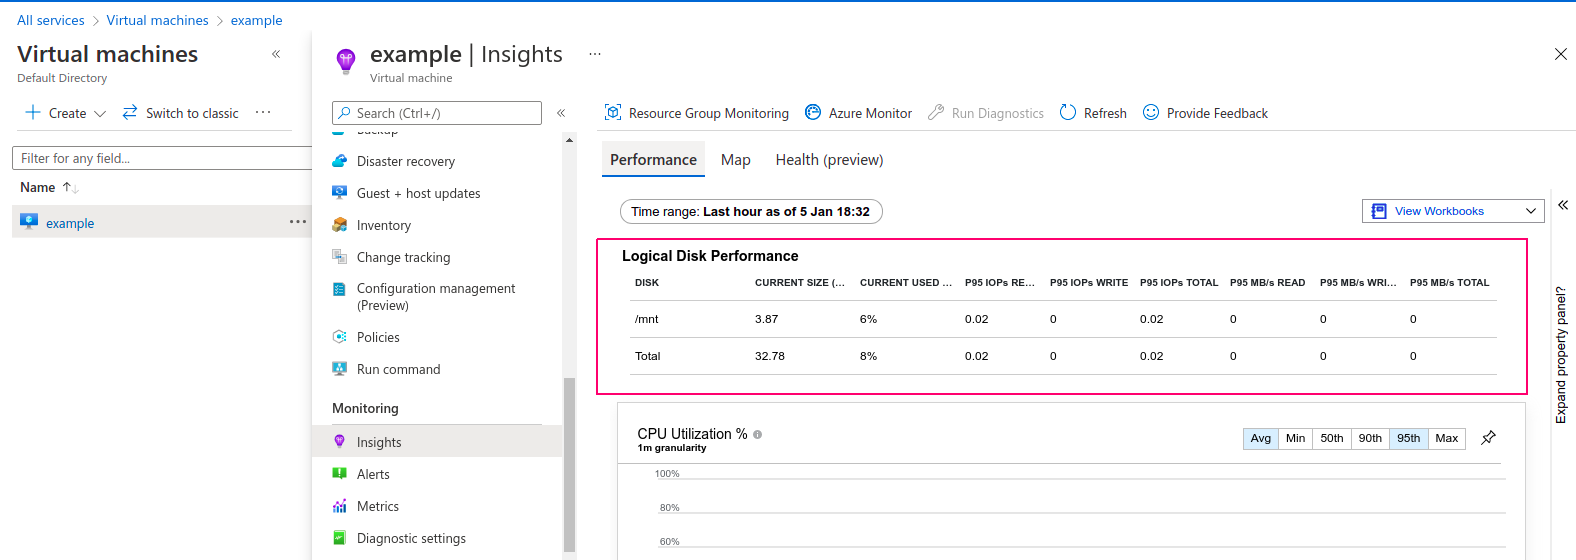
- Click on Performance.
To install the agent on virtual machine using the Azure Log Analytics VM extension for Linux.
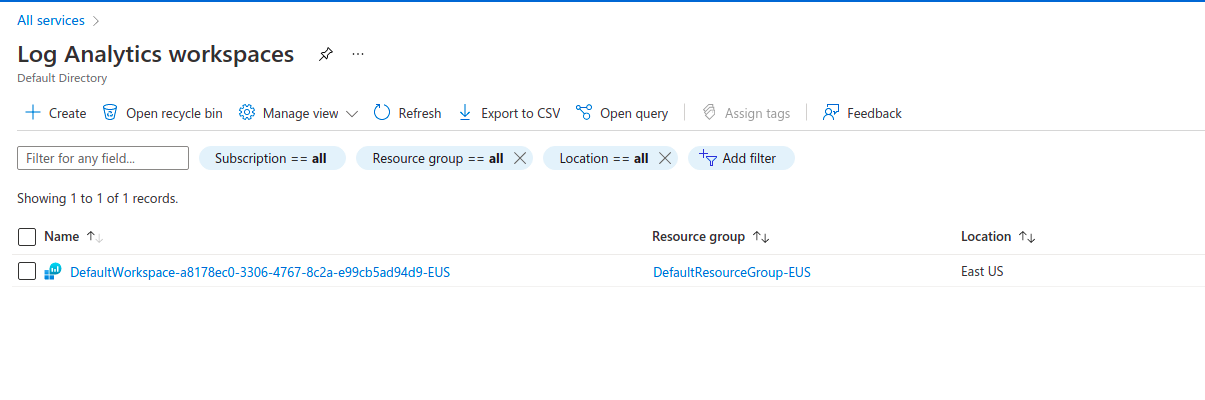
- Go to Log analytics workspaces.
- In log analytics workspace home page click on default created workspace.
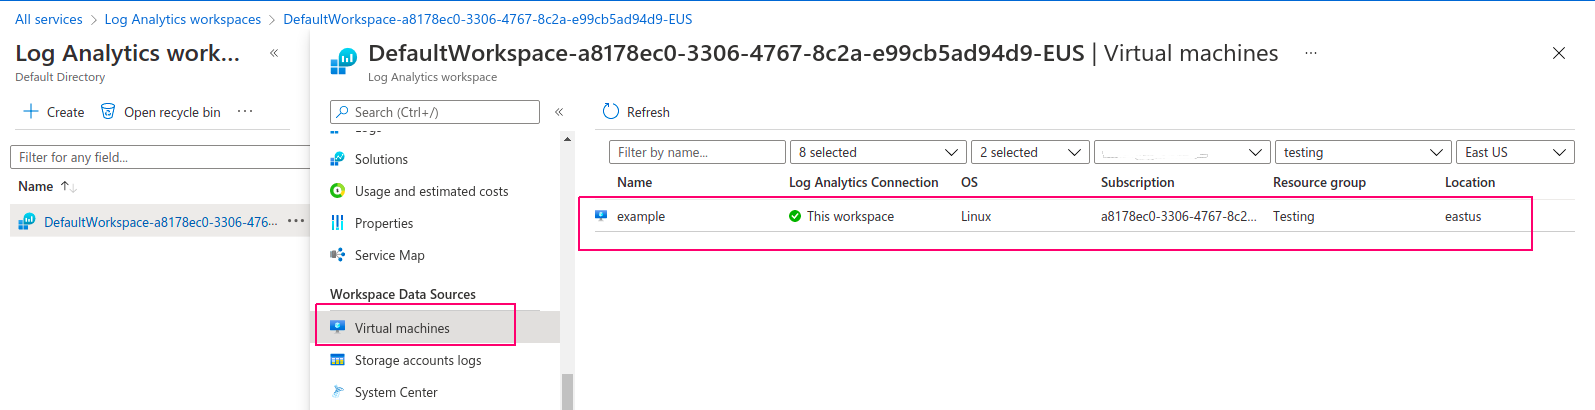
- In Overview page,first click on virtual machine & check the created virtual machine is connected or not.If Not connected so connect the virtual machine with log analytic workspace.
- Now Click on Agent management.Select Server Windows or Linux.If we are using windows server then run the windows agent command & if using Linux server then run the linux agent command.
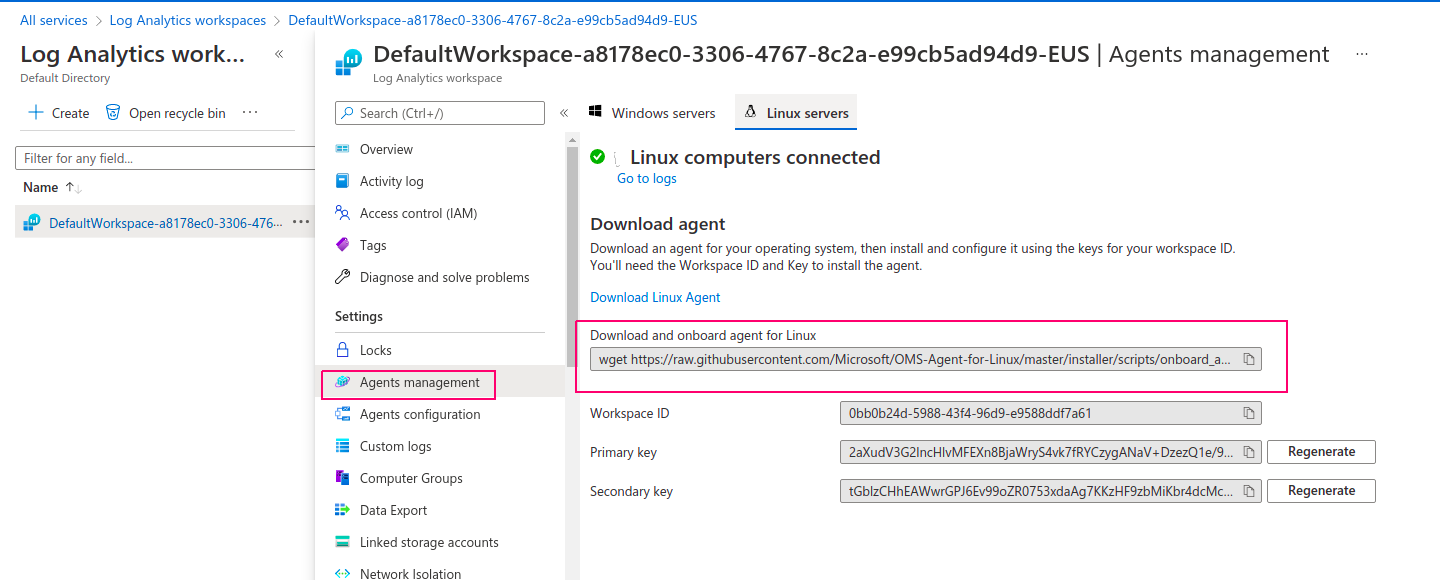
- Linux Server Agent Installation Syntax are given below:
wget https://raw.githubusercontent.com/Microsoft/OMS-Agent-for-Linux/master/installer/scripts/onboard_agent.sh && sh onboard_agent.sh -w <-s < -d opinsights.azure.com
- Then login to virtual machine using ssh.
ssh user-name@public-ip-address
- Here is the command output.
root@ip-174-311-315-10:/home/ubuntu# ssh azure@40.121.232.27

The authenticity of host '40.121.232.27 (40.121.232.27)' can't be established.

ECDSA key fingerprint is SHA256:rhcG7n0PGr/McnR5IcWjxO+Yc4RmbM+ZdJzBLkq76ik.

Are you sure you want to continue connecting (yes/no/[fingerprint])? yes

Warning: Permanently added '40.121.232.27' (ECDSA) to the list of known hosts.

azure@40.121.232.27's password:

Welcome to Ubuntu 20.04.3 LTS (GNU/Linux 5.11.0-1023-azure x86_64)

* Documentation: https://help.ubuntu.com

* Management: https://landscape.canonical.com

* Support: https://ubuntu.com/advantage

System information as of Wed Jan 5 12:59:55 UTC 2022

System load: 0.01 Processes: 111

Usage of /: 7.9% of 28.90GB Users logged in: 0

Memory usage: 34% IPv4 address for eth0: 10.1.0.4

Swap usage: 0%

1 update can be applied immediately.

To see these additional updates run: apt list --upgradable

The programs included with the Ubuntu system are free software;

the exact distribution terms for each program are described in the

individual files in /usr/share/doc/*/copyright.

Ubuntu comes with ABSOLUTELY NO WARRANTY, to the extent permitted by

applicable law.

To run a command as administrator (user "root"), use "sudo <command>".

See "man sudo_root" for details.

azure@example:~$ sudo su

root@example:/home/azure#
- Update the System.
apt-get update
- Copy the Linux Server Agent installation command from Agent Management in log analytic workspace then paste on virtual machine.
- Here is the command output.
root@example:/home/azure# wget https://raw.githubusercontent.com/Microsoft/OMS-Agent-for-Linux/master/installer/scripts/onboard_agent.sh && sh onboard_agent.sh -w 0bb0b24d-5988-43f4-96d9-e9588ddf7a61 -s 2aXudV3G2lncHlvMFEXn8BjaWryS4vk7fRYCzygANaV+DzezQ1e/9CfM7UkqBCY7zwxoG6h3IWJ/6zoHXFJ90w== -d opinsights.azure.com

--2022-01-05 13:00:51-- https://raw.githubusercontent.com/Microsoft/OMS-Agent-for-Linux/master/installer/scripts/onboard_agent.sh

Resolving raw.githubusercontent.com (raw.githubusercontent.com)... 185.199.109.133, 185.199.108.133, 185.199.111.133, ...

Connecting to raw.githubusercontent.com (raw.githubusercontent.com)|185.199.109.133|:443... connected.

HTTP request sent, awaiting response... 200 OK

Length: 3182 (3.1K) [text/plain]

Saving to: ‘onboard_agent.sh’

onboard_agent.sh 100%[===========================================================================================>] 3.11K --.-KB/s in 0s

2022-01-05 13:00:51 (43.5 MB/s) - ‘onboard_agent.sh’ saved [3182/3182]

....

Extracting...

Updating auoms ...

----- Updating package: auoms (auoms-2.3.4-31.universal.x64) -----

Skipping package since existing version >= version available

OMS Troubleshooter is installed.

You can run the Troubleshooter with the following command:

$ sudo /opt/microsoft/omsagent/bin/troubleshooter

Shell bundle exiting with code 0
- Install debugger (gbd) & run sudo /opt/microsoft/omsagent/bin/troubleshooter command for Troubleshooting command.
apt install gdb

sudo /opt/microsoft/omsagent/bin/troubleshooter
- Type A for run all scenarios.
root@example:/home/azure# sudo /opt/microsoft/omsagent/bin/troubleshooter

Checking for python install...

Checking all necessary python modules are installed...

Checking all necessary programs are installed...

Running troubleshooting tool in Python 3.8.10...

Welcome to the OMS Agent for Linux Troubleshooter! What is your issue?

================================================================================

1: Agent is unhealthy or heartbeat data missing.

2: Agent doesn't start, can't connect to Log Analytic Services.

3: Syslog issue.

4: Agent consuming high CPU/memory.

5: Installation failures.

6: Custom logs issue.

================================================================================

A: Run through all scenarios.

L: Collect the logs for OMS Agent.

Q: Press 'Q' to quit.

================================================================================

Please select an option: A
- Type s.
The troubleshooter can be run in two different modes.

- Silent Mode runs through with no input required

- Interactive Mode includes extra checks that require input

Do you want to run the troubleshooter in silent (s) or interactive (i) mode?: s

Running troubleshooter in silent mode...

================================================================================

CHECKING INSTALLATION...

Checking if running a supported OS version...

Traceback (most recent call last):

File "/opt/microsoft/omsagent/tst/modules/helpers.py", line 65, in get_os_version

(vm_dist, vm_ver, vm_id) = platform.linux_distribution()

AttributeError: module 'platform' has no attribute 'linux_distribution'

During handling of the above exception, another exception occurred:

Traceback (most recent call last):

File "/opt/microsoft/omsagent/tst/modules/main.py", line 254, in <module>

run_troubleshooter()

File "/opt/microsoft/omsagent/tst/modules/main.py", line 204, in run_troubleshooter

success = section(interactive=interactive_mode)

File "/opt/microsoft/omsagent/tst/modules/main.py", line 58, in check_all

checked_install = check_installation(interactive)

File "/opt/microsoft/omsagent/tst/modules/install/install.py", line 111, in check_installation

checked_os = check_os()

File "/opt/microsoft/omsagent/tst/modules/install/check_os.py", line 87, in check_os

vm_info = get_os_version()

File "/opt/microsoft/omsagent/tst/modules/helpers.py", line 67, in get_os_version

(vm_dist, vm_ver, vm_id) = platform.dist()

AttributeError: module 'platform' has no attribute 'dist'
- Once Agent is installed.
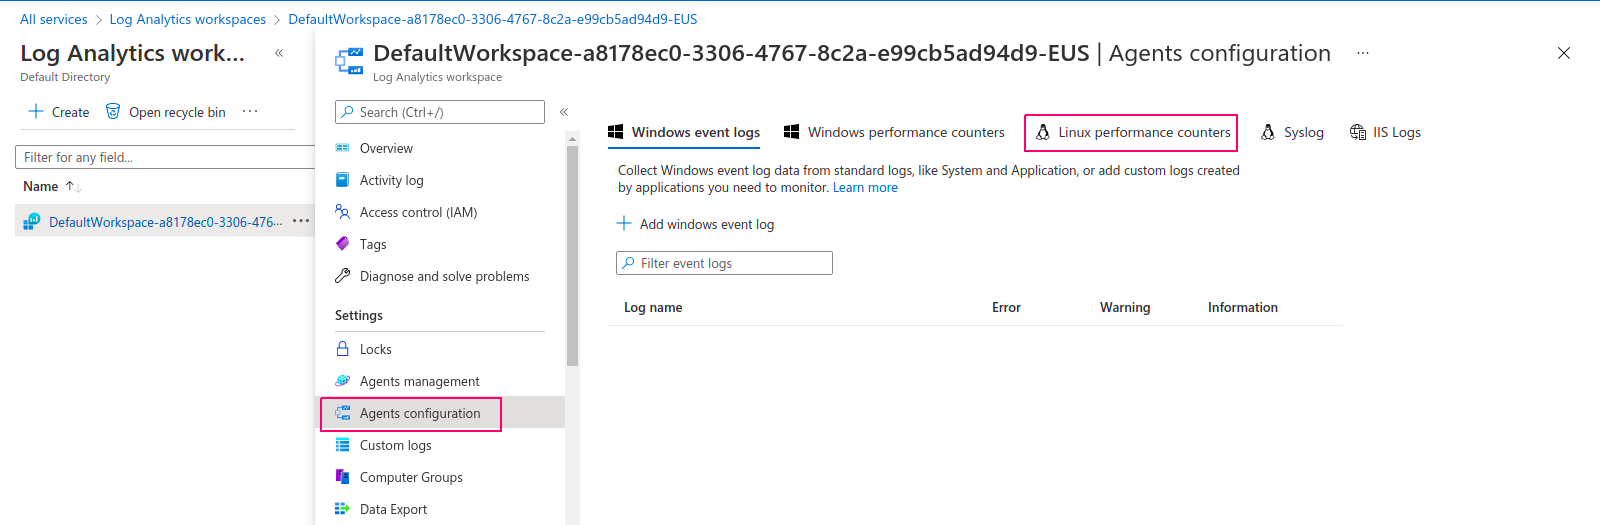
- Go to Agent Configuration.
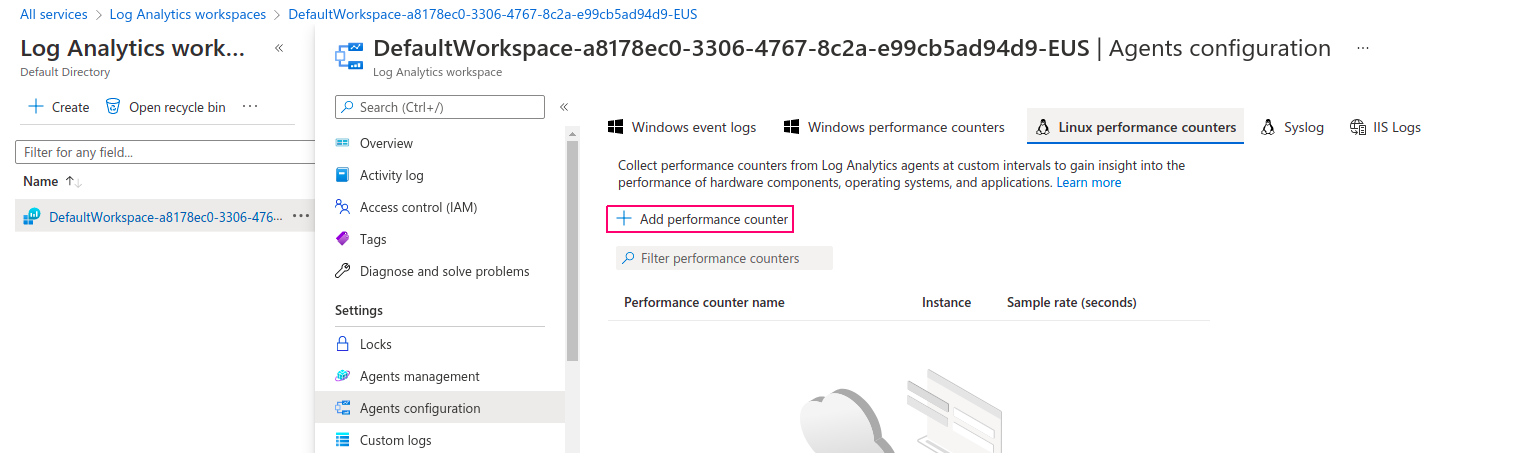
- Click on Linux performance Counters.
- Click on Add performance counter.
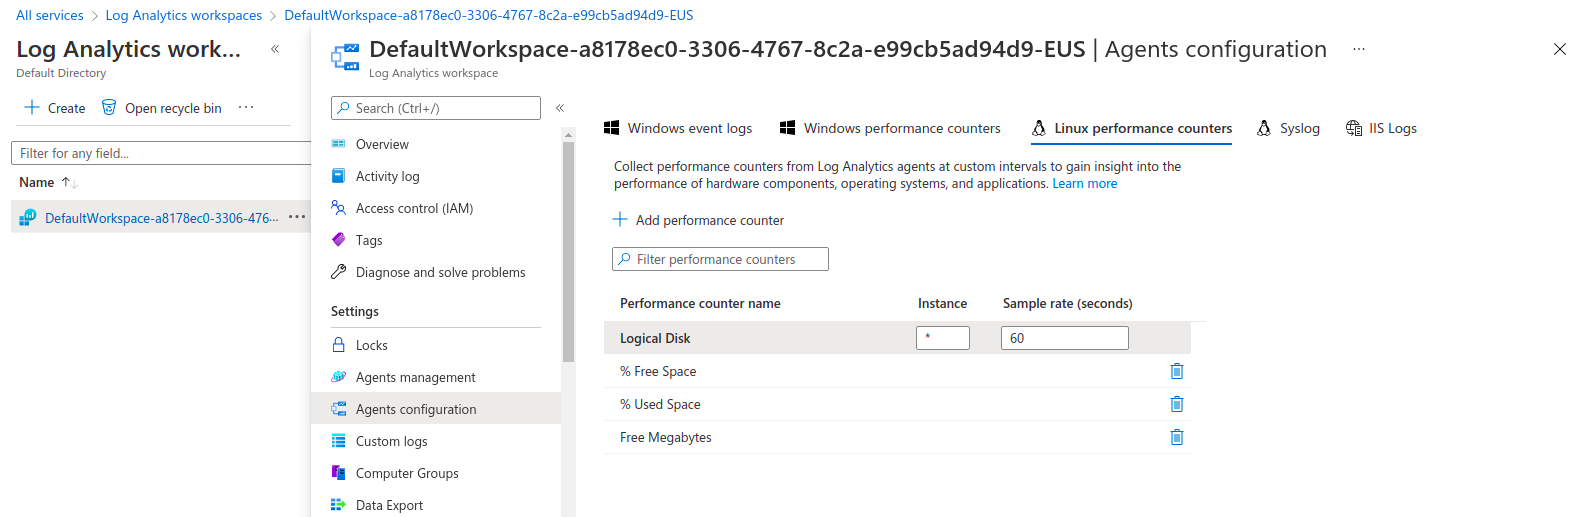
- Add the following performance counter name:
Logical Disk\% Free Space

Logical Disk\% Used Space

Logical Disk\%Free Megabytes
- Click on Apply.
- Go to Virtual machine Insights & Click on Performance.
- Now the Logical Disk performance are available on virtual machine insights.There are Two disk name are displayed :/mnt & Total (/). Scroll down the page & see the following Graphs.
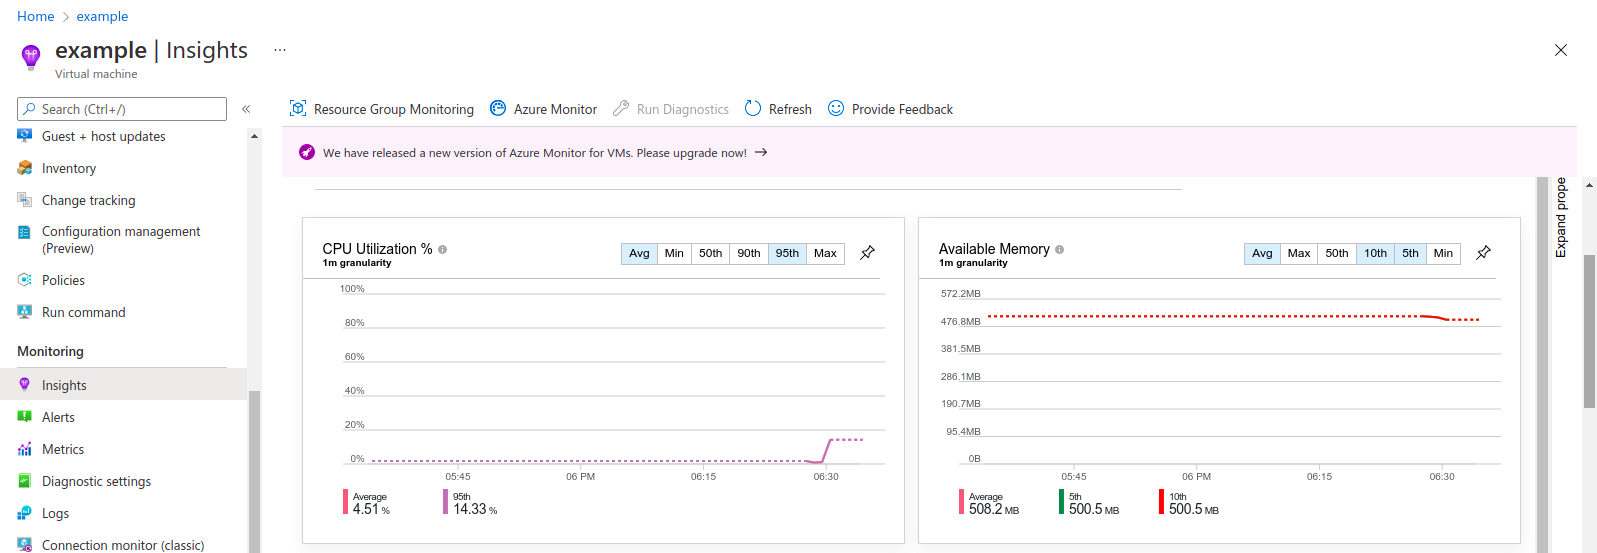
- CPU Utilization Graph & Available memory Graph.
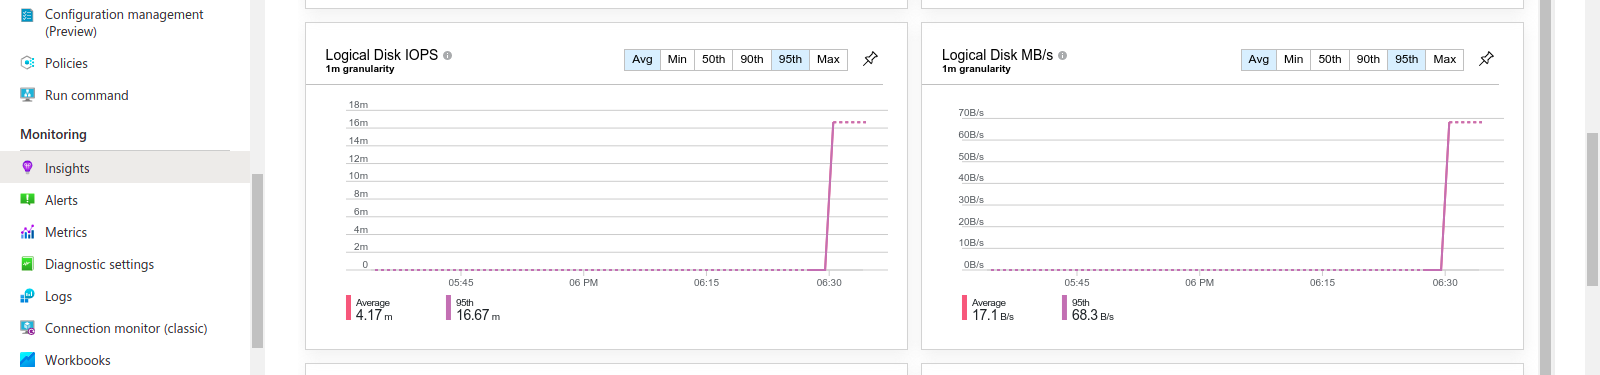
- Logical Disk IOPS & Logical Disk MB/s Graph.
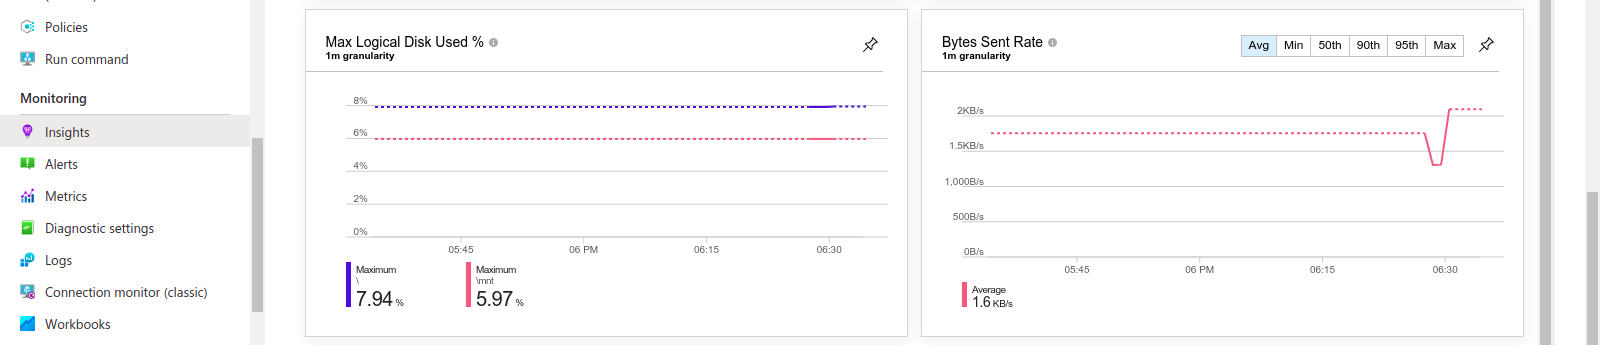
- Max Logical Disk Used% & Bytes Sent Rate Graph.
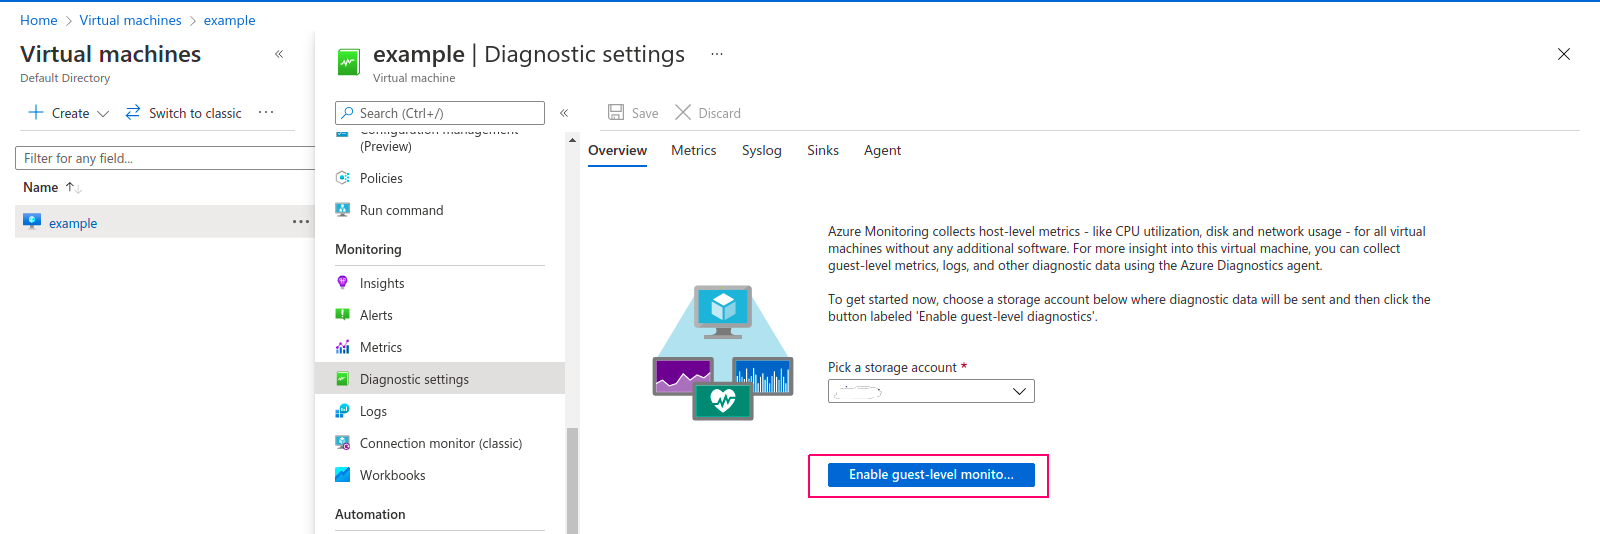
- We need a storage account so first create a storage account.
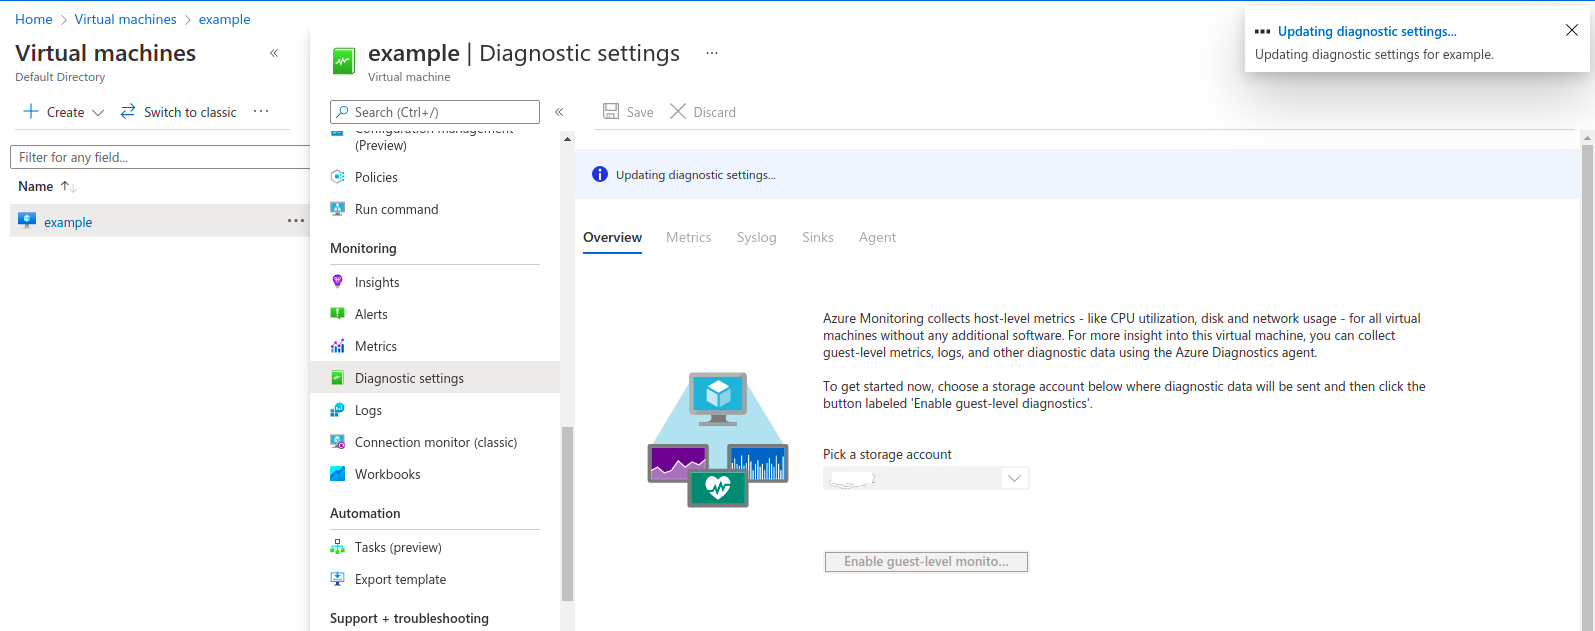
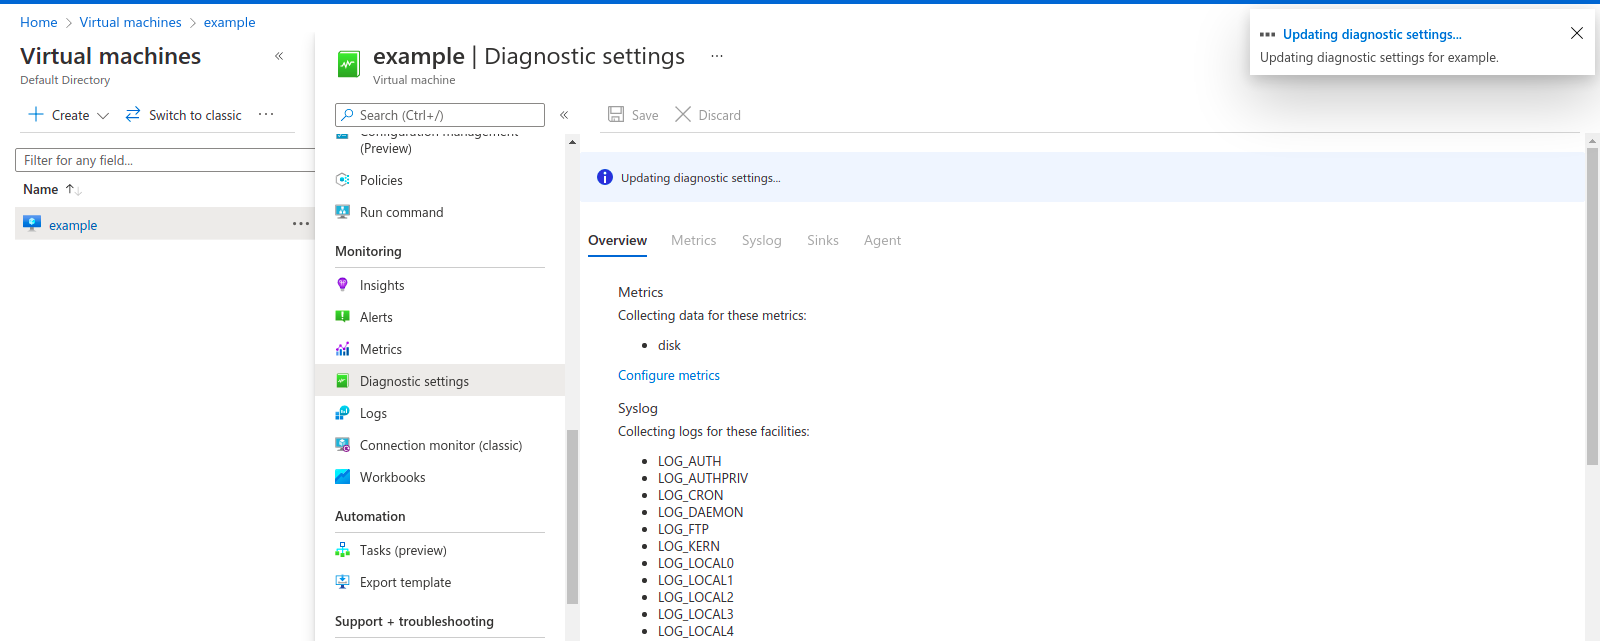
- Then click On Diagnostic settings,Select a created storage account name & Click on Enable Guest-level monitoring.During Updating,Diagnostic settings gives some error.Please ignore the errors.
- In Diagnostic settings,click on Metrics.
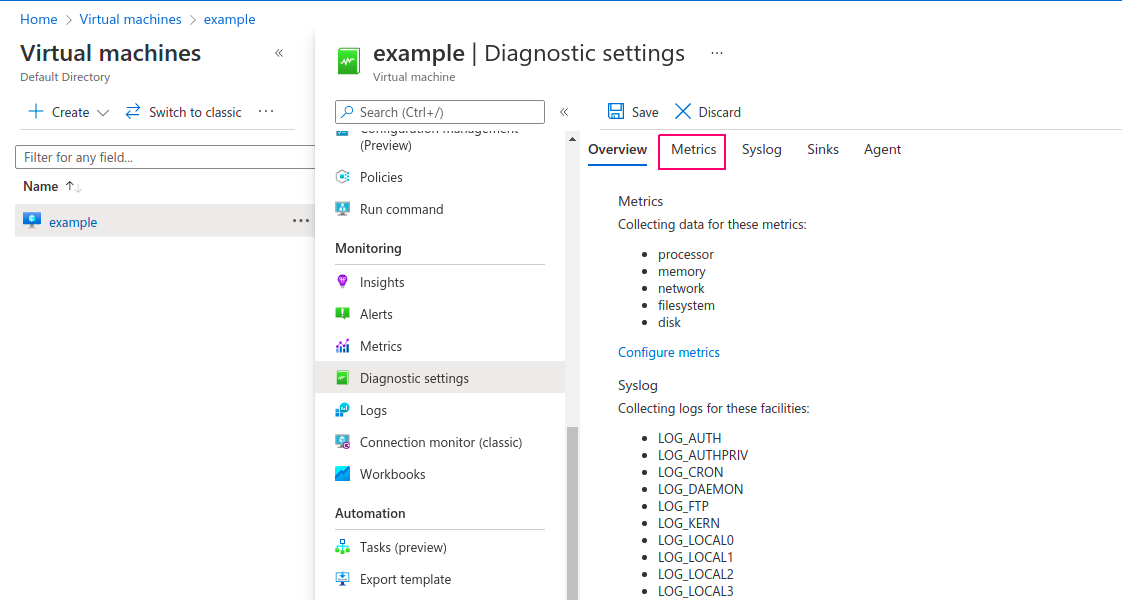
- Select Only Disk.
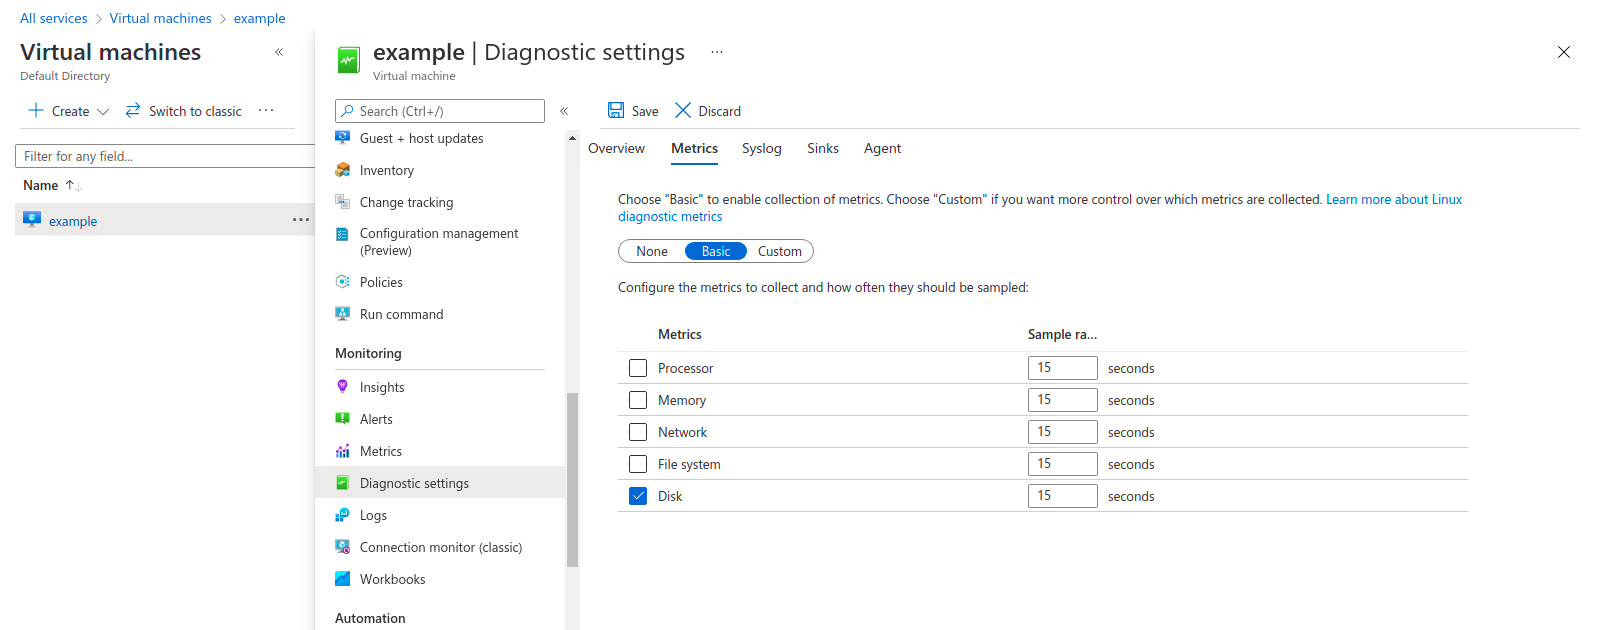
- Click on Save.Again during updating,it gives error.Again ignore the error.
- Refresh the Microsoft azure Page or wait for some time.
- Click on Metrics.
- By default Scope is selected.
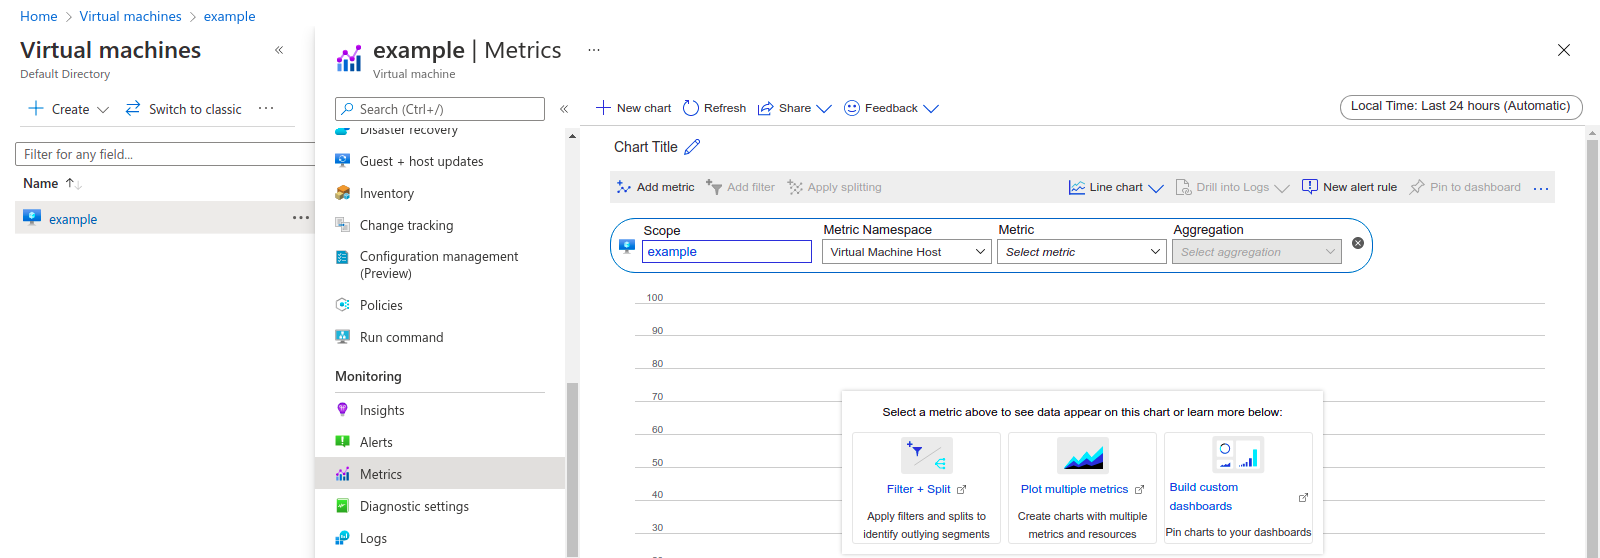
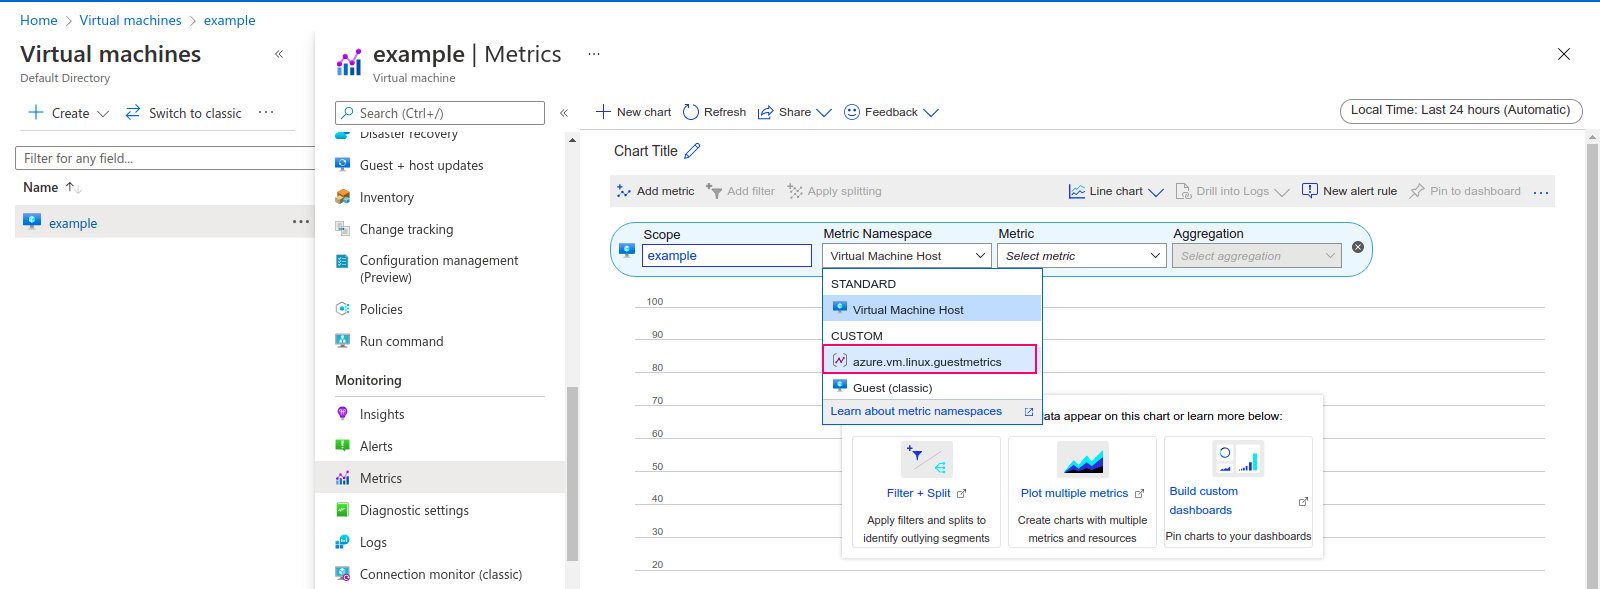
- Click on Metrics namespace.We can see that two custom metric namespace are available so click on azure.vm.linux.guestmetrics.
- Select cpu/usage_active or disk/free_present metric & Select aggregation.
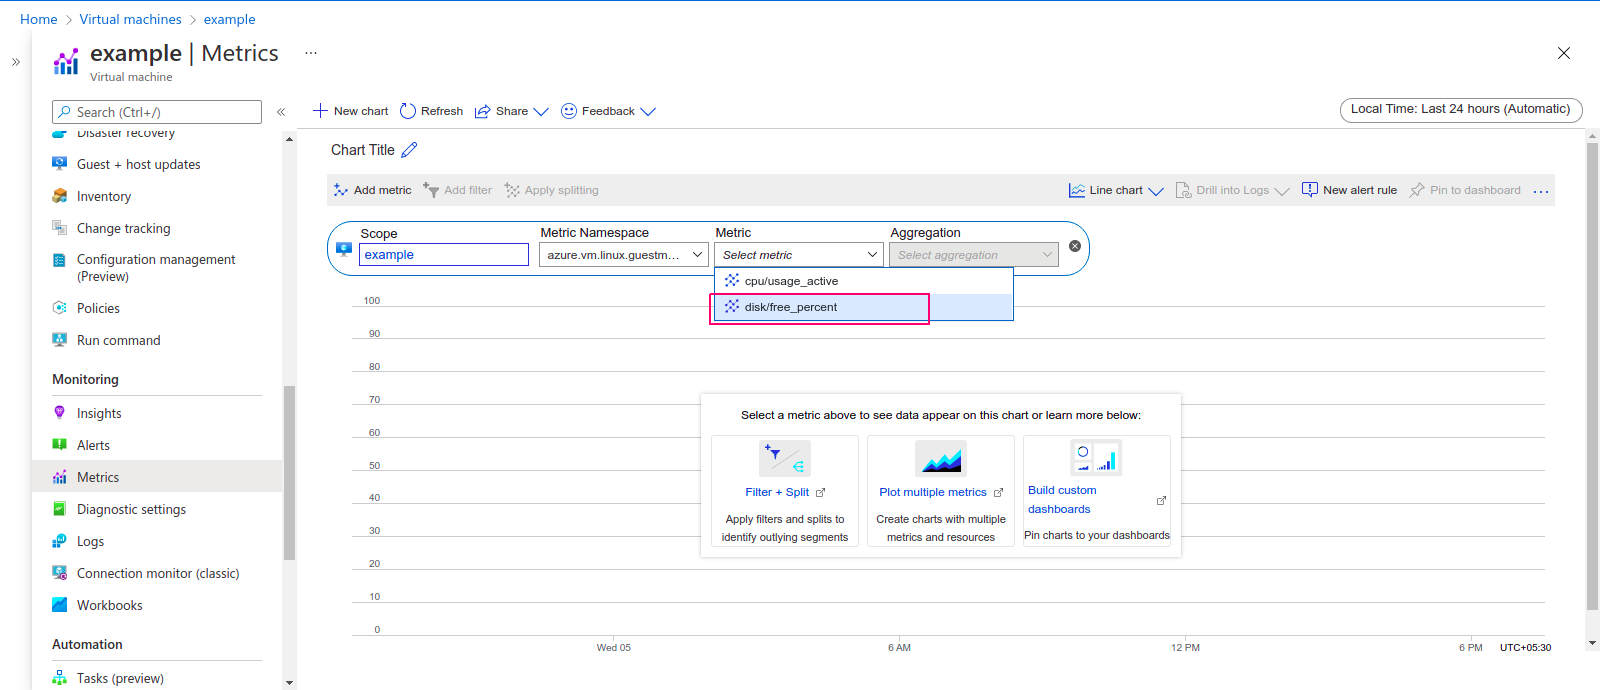
- After this,Graph is Ready.
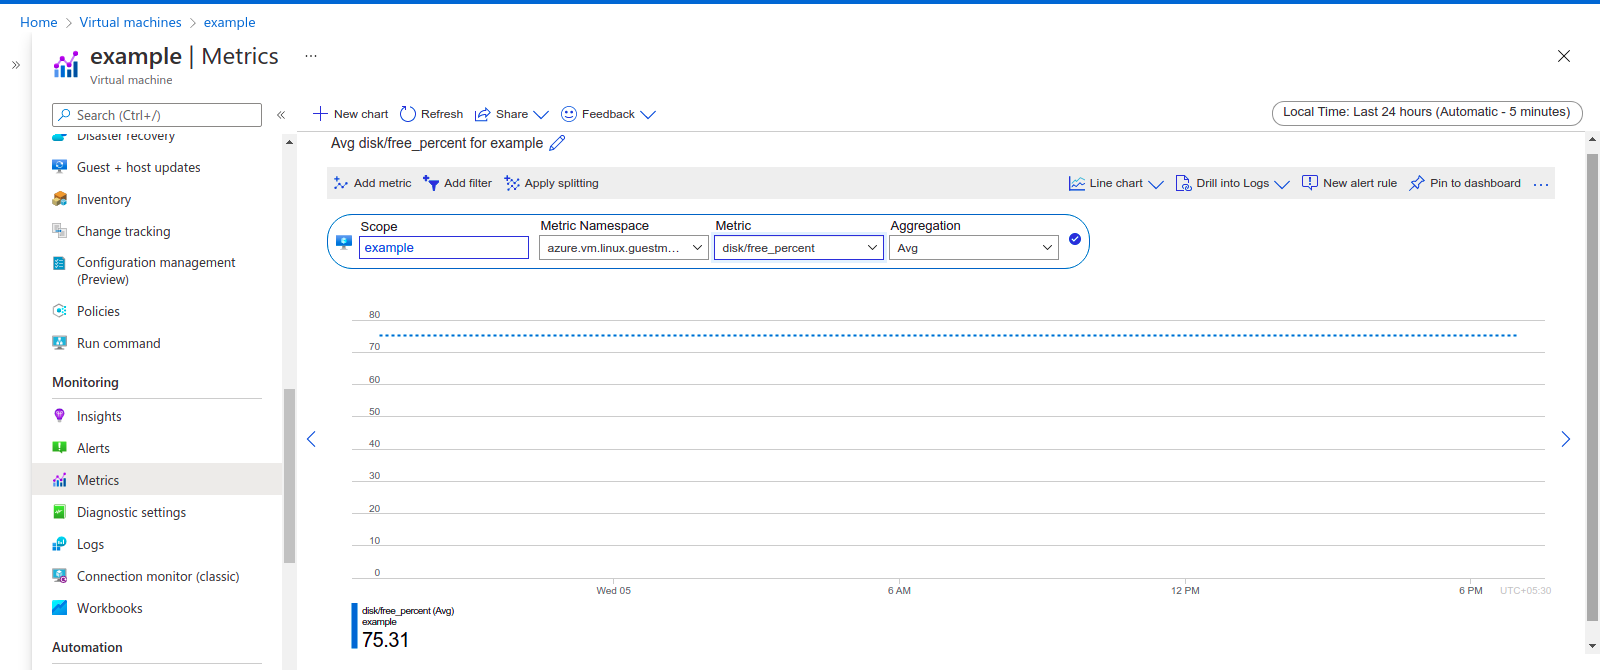
- Now we have multiple options such as choose graph chart, create alert rule, pin to dashboard, create new chart & Add metric.
- Click on the following link for how to manage metrics & create Alert rule for metrics https://www.hackerxone.com/2022/01/10/step-by-step-guide-to-create-metrics-set-alert-rule-using-monitor-in-azure/